Taxes on Investment Growth: Tax Drag Explained
Taxes on investment growth can quietly reduce compounding, change after-tax returns, and make two portfolios with the same pre-tax performance end very differently.
Quick answer
Taxes on investment growth are the taxes that can apply when your portfolio earns dividends, interest, capital gains, or withdrawals. They matter because investment projections are often shown before taxes, while real planning happens after taxes. A portfolio that appears to grow at 7 percent may deliver a lower after-tax return once taxable distributions, realized gains, and account rules are considered.
The key idea is tax drag. Tax drag is the difference between the return your portfolio earns before taxes and the return you actually keep after taxes. Even a small annual drag can compound into a large gap over 10, 20, or 30 years. That is why long-term investors should compare nominal growth, fee drag, inflation drag, and after-tax growth before trusting a future-value number. A clear taxes on investment growth workflow makes that gap visible before the decision becomes expensive.
What taxes on investment growth really mean
Taxes on investment growth do not mean that every dollar in your portfolio is taxed every year. The real impact depends on what kind of return you earn, where the asset is held, whether gains are realized, and whether the investment distributes income along the way. A broad index fund, a high-yield bond fund, a dividend stock, a crypto position, and a retirement account withdrawal can all create different tax outcomes.
For planning purposes, the important distinction is between a pre-tax projection and an after-tax projection. A pre-tax projection asks: what would the portfolio be worth if the return compounded without tax friction? An after-tax projection asks: what might the investor actually keep after taxes reduce part of the return? The second question is usually more useful when the decision affects real savings behavior, retirement planning, or portfolio comparisons.
This does not mean every investor needs a complicated tax model before making any decision. It means that tax assumptions should be visible. When you compare two portfolios, two contribution schedules, or two account choices, taxes can change which plan is more efficient. A portfolio with a slightly lower headline return may create a better after-tax result if it distributes less taxable income or allows gains to compound longer.
Think of taxes as one layer of reality. A clean calculator can help you understand compounding, but a better planning workflow eventually asks what happens after fees, inflation and taxes. That is the role of the WhatIfInvested tool system: start simple, then add realism only when the decision requires it.
Tax drag vs fee drag vs inflation drag
Tax drag is often confused with fee drag and inflation drag. They all reduce the usefulness of a headline return, but they do it in different ways. Fee drag comes from costs inside or around the investment. Inflation drag comes from rising prices reducing purchasing power. Tax drag comes from part of the investment return going to taxes instead of staying invested.
These drags can stack. A portfolio might earn 8 percent before fees. After a 0.60 percent expense ratio, it might keep 7.40 percent before taxes. If some of that return is taxed during the holding period, the after-tax compounding rate might be lower again. If inflation averages 3 percent, the real purchasing-power growth is lower still. None of these numbers means the investment is bad. They simply make the projection more honest.
This is why taxes on investment growth belong in the same mental model as fees and inflation. Investors often optimize the visible expense ratio, then ignore a larger hidden tax cost. A fund with high turnover can realize gains frequently. A high-income asset can distribute taxable income every year. A strategy that rebalances aggressively can create taxable events. Those details may not matter inside a tax-advantaged account, but they can matter a lot in a taxable account. In practice, taxes on investment growth should be reviewed whenever two portfolios look similar before tax but behave differently after tax.
| Drag type | What it reduces | Common cause | Planning question |
|---|---|---|---|
| Fee drag | Portfolio return | Expense ratios, management fees, transaction costs | Is the cost worth the value received? |
| Inflation drag | Purchasing power | Rising prices over time | What will the money actually buy later? |
| Tax drag | After-tax return | Dividends, interest, realized gains, withdrawals | How much of the return stays invested? |
For a deeper companion topic, read the guide on how investment fees affect compound growth. Then compare the real-return side with inflation adjusted investment growth. Together, these three topics explain why a future value number is only the beginning of the planning process.
Which taxes can affect investment growth?
The exact tax treatment depends on your country, account type, asset, holding period and personal situation. This article is educational, not tax advice. Still, most investors should understand the broad categories because they influence how portfolio growth is modeled. In the United States, the IRS provides general information on capital gains and losses. Investors in other jurisdictions should check their local tax authority or a qualified professional. A taxes on investment growth comparison is strongest when it separates general education from personal tax advice.
Capital gains tax
Capital gains generally happen when you sell an investment for more than you paid. The tax effect may depend on whether the gain is short term or long term, whether losses can offset gains, and whether the asset is held in a taxable or tax-advantaged account. From a compounding perspective, the timing matters. Paying tax every year can reduce the amount that remains invested. Deferring taxes until later can leave more capital compounding along the way.
Dividend tax
Dividends can be useful for income, but taxable dividends may create annual tax drag. A dividend-focused portfolio can look attractive because cash flow feels tangible. Yet if those dividends are taxed each year, the after-tax compounding path may differ from a lower-yield portfolio that grows more through deferred capital gains. That does not make dividends bad. It means the investor should compare income, reinvestment and tax treatment together.
Interest income
Interest from savings products, bonds or fixed-income funds may be taxed differently from qualified dividends or long-term capital gains. In many systems, interest can be relatively tax-inefficient in taxable accounts. That is why asset location matters. The same bond fund may have a different after-tax role depending on whether it is held in a taxable account, retirement account or another sheltered structure.
Withdrawal taxes
Some accounts defer taxes until withdrawals. In that case, the portfolio may compound without annual tax drag, but the investor eventually faces tax when money comes out. A projection that only shows the account balance can overstate spendable wealth if withdrawals are taxable. For long-term planning, the useful question is not only “what will the account be worth?” It is also “what amount can support spending after taxes?”
Why account type changes after-tax returns
Account type can be one of the largest variables in after-tax investment growth. A taxable brokerage account, a tax-deferred retirement account, and a tax-free or tax-sheltered account can treat the same investment differently. This creates a planning challenge: the best asset is not always just the one with the best pre-tax return. Sometimes the best structure is the one that lets a suitable investment compound with less friction.
In a taxable account, annual distributions and realized gains may matter. In a tax-deferred account, the current-year tax impact may be lower or delayed, but withdrawals may be taxable later. In a tax-free account, qualifying growth may avoid tax if the rules are followed. The names of these accounts vary by country, and the details can be complex. The planning principle is simpler: taxes on investment growth depend on location as much as selection. That is why taxes on investment growth should be modeled by account type, not only by asset name.
For WhatIfInvested, this matters because the same user may run several scenarios: a taxable plan, a retirement plan, a high-income strategy, and a low-turnover growth strategy. A simple calculator is enough to understand the mechanics. A more advanced workflow becomes useful when the investor wants to save scenarios, compare assumptions, and see how tax drag interacts with fees, inflation and contributions. That is where a public article naturally leads toward the Premium planning offer on Pricing.
A simple after-tax compounding example
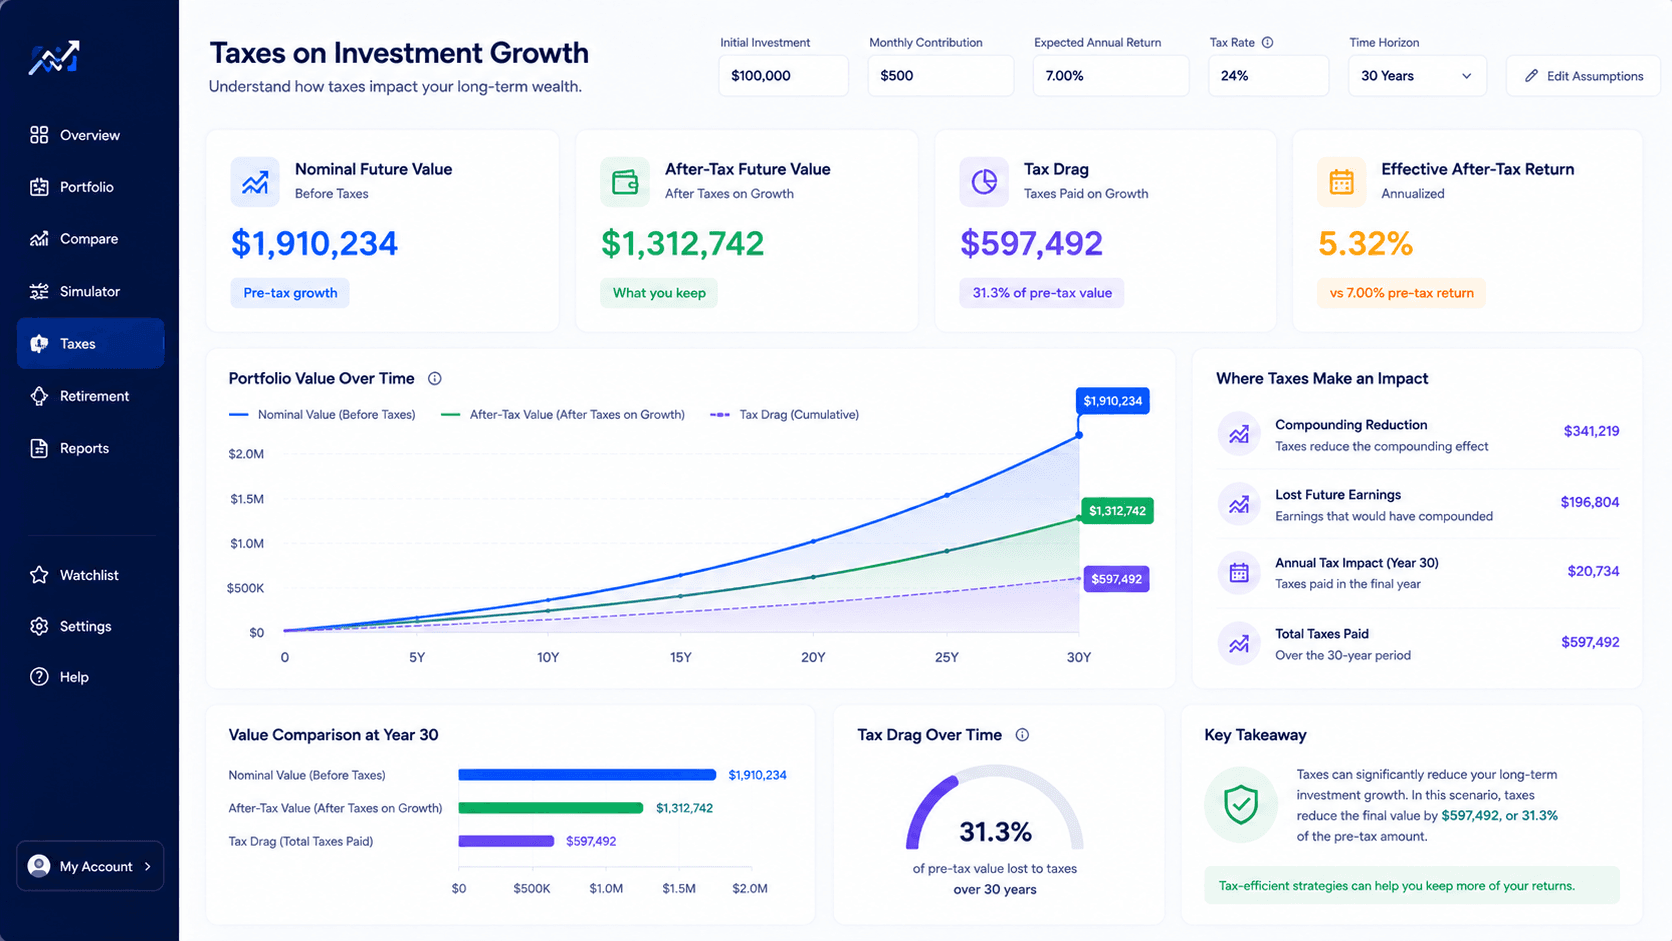
Imagine an investor starts with $100,000 and earns a steady 7 percent annual return for 30 years. In a simple pre-tax model, the portfolio grows to about $761,000. That number is useful because it shows the power of time. But if taxes reduce the effective compounding rate to 6 percent, the ending value falls to about $574,000. If the after-tax compounding rate is 5.5 percent, the ending value falls to about $498,000.
The lesson is not that a 7 percent return is unrealistic. The lesson is that the retained return matters. A small annual difference becomes large because it is applied repeatedly. Taxes on investment growth can therefore behave like a silent reduction in the compounding rate. The longer the timeline, the more visible the gap becomes.
| Scenario | Assumed compounding rate | Starting value | Approx. value after 30 years | Planning interpretation |
|---|---|---|---|---|
| Pre-tax projection | 7.0% | $100,000 | $761,000 | Useful headline future value |
| Moderate tax drag | 6.0% | $100,000 | $574,000 | More realistic taxable-account view |
| Higher tax drag | 5.5% | $100,000 | $498,000 | Shows the cost of lower retained returns |
This simplified example does not predict your tax bill. Real taxes are not usually a smooth annual percentage. They can depend on income, realized gains, dividends, loss harvesting, account rules and withdrawal timing. But as a planning lens, reducing the effective return is useful. It helps you understand why after-tax returns deserve attention before you compare strategies only by final pre-tax value. A simple taxes on investment growth scenario can expose whether the plan is robust or only attractive before tax.
If you want to test the broad math first, use the Compound Interest Calculator. If your question is about recurring contributions, compare it with the guide on compound interest with monthly contributions. If the question becomes historical, move to the Investment Simulator.
How contributions, rebalancing and withdrawals change the result
Taxes on investment growth do not only depend on the asset. They also depend on behavior. Contributions, rebalancing and withdrawals all change the path of the portfolio. When money enters regularly, the investor buys at different prices. When allocations are rebalanced, assets may be sold. When money is withdrawn, taxable income or realized gains may be created depending on the account.
Recurring contributions
A monthly investor may be focused on contribution amount, investment frequency and timeline. The tax question is usually secondary at first, but it becomes more important as balances grow. If the assets distribute taxable income each year, the compounding path differs from a portfolio that mainly grows through unrealized gains. Use the DCA Calculator when the rhythm of contributions is the main question.
Rebalancing
Rebalancing can improve risk control, but it may create taxable events in taxable accounts. A portfolio that sells winners frequently may realize gains earlier than necessary. A portfolio that never rebalances may become concentrated. The right answer is not always obvious. The goal is to compare risk control against tax drag and decide whether the benefit of rebalancing is worth the friction.
Withdrawals
Withdrawals turn portfolio value into usable cash. If withdrawals are taxable, the amount shown in an account is not the same as the amount available for spending. That is especially important for retirement planning, income strategies, and large one-time goals. A projection can look strong on paper while still leaving a gap after taxes and inflation.
This is why WhatIfInvested separates simple calculators from more advanced planning. A free tool should answer the first question clearly. Premium planning becomes more valuable when the question includes several assumptions at once: tax drag, fee drag, inflation, saved scenarios, exports and strategy comparisons. Taxes on investment growth are rarely isolated, so the best workflow connects them to contributions, withdrawals and portfolio structure.
How to model tax drag in WhatIfInvested
A good workflow starts with the least complex tool that can answer the current question. If you are only trying to understand how a starting balance and monthly contribution can grow, start with the Compound Interest Calculator. Enter your initial amount, contribution, timeline and expected annual return. Then run a second scenario with a lower return assumption to approximate tax drag. For example, compare 7 percent pre-tax growth with 6 percent after-tax growth.
If your question is about recurring investing, contribution timing, and market entry, use the DCA Calculator. It is better when the behavior of investing over time matters more than a smooth future-value assumption. If you want to compare historical assets, use the Investment Simulator. It can show how real market paths behaved instead of assuming a straight-line annual return.
When the workflow becomes more serious, compare Premium planning on Pricing. The Premium path is not only about one calculator. It is about a planning workspace where you can compare scenarios, save assumptions, export reports, and think through fees, inflation, withdrawals and tax drag together. This is especially useful when taxes on investment growth change the conclusion between two otherwise similar scenarios.
How to interpret after-tax investment projections
After-tax projections are most useful when they are treated as decision ranges, not exact promises. A clean future-value estimate can show the relationship between time, return and contributions. A tax-aware projection adds another question: how much of that growth might remain available after the tax system takes its share? The answer is not fixed, because tax rates, income levels, account rules and selling decisions can change. Still, the exercise is valuable because it prevents one of the most common planning errors: mistaking a gross account value for spendable wealth.
One practical method is to compare three versions of the same plan. The first version is the optimistic pre-tax case. This is the headline growth number, and it helps you understand the power of compounding. The second version is a moderate after-tax case, where the expected return is reduced slightly to represent tax drag. The third version is a conservative case, where taxes, fees and inflation are all represented more aggressively. If your plan only works in the optimistic case, it may be fragile. If it still works in the conservative case, it is more resilient.
This is also where investor behavior matters. A long-term investor who rarely sells may defer capital gains for years. A trader who realizes gains frequently may face more taxable events. A dividend investor may receive steady income but also steady tax reporting. A retiree taking withdrawals has a different problem: turning portfolio value into after-tax cash flow. The same portfolio can therefore serve different people differently, because taxes on investment growth are connected to behavior, not only to the investment product.
Another useful habit is to separate tax efficiency from investment quality. A tax-efficient investment is not automatically a good investment. A high-return investment is not automatically the best after-tax choice. A low-tax structure is not helpful if the underlying strategy is unsuitable. The goal is not to minimize taxes at all costs. The goal is to make the investment decision, account decision and withdrawal decision work together.
For example, an investor comparing a high-turnover strategy with a low-cost index approach should not only ask which one had the better historical return. They should ask which one produced better after-tax returns, which one had lower fees, which one created more taxable distributions, and which one was easier to hold through volatility. The compound growth vs DCA workflow helps decide which tool fits the question, while the Investment Simulator can help test market history when the question becomes asset-specific.
The final interpretation should be humble. Taxes are personal. A public calculator cannot know every detail of your income, jurisdiction, account eligibility, cost basis, loss carryforwards or withdrawal rules. But it can make the decision more transparent. If a tax drag assumption changes the result dramatically, that is a signal to slow down, compare scenarios, and get professional help before making a high-stakes decision. For that reason, taxes on investment growth should be treated as a planning sensitivity, not a guaranteed forecast.
Common mistakes investors make with taxes on investment growth
Mistake 1: comparing only pre-tax final value
Two portfolios can show similar pre-tax returns and very different after-tax outcomes. If one portfolio creates taxable income every year and the other defers more gains, the second portfolio may keep more money compounding. This does not always decide the winner, but it should be part of the comparison.
Mistake 2: ignoring account location
Investors often ask which asset is best without asking where it will be held. Account location can change the answer. A tax-efficient asset may be fine in a taxable account, while a tax-inefficient asset may fit better in a sheltered account. The details depend on local rules, but the principle is universal.
Mistake 3: assuming dividends are free return
Dividends are part of total return, not magic income. If they are taxable and reinvested after tax, the compounding path differs from a portfolio that retains more value internally. Dividend strategies can still be useful, especially for income planning, but they should be evaluated after taxes.
Mistake 4: forgetting rebalancing friction
Rebalancing can be valuable, but taxable rebalancing can create friction. The right frequency depends on risk, account type, costs and tax treatment. A portfolio that looks elegant in theory may be less efficient if it forces frequent taxable sales.
Mistake 5: treating tax assumptions as precise forecasts
Tax laws change. Income changes. Account rules vary. A tax drag assumption is not a perfect forecast. It is a planning stress test. The goal is to understand sensitivity: if taxes reduce returns by 0.5 percent or 1 percent per year, does the plan still work?
FAQ
What are taxes on investment growth?
Taxes on investment growth are taxes that may apply to dividends, interest, realized capital gains, withdrawals or other taxable investment activity. The exact rules depend on your jurisdiction, account type and personal situation.
How do taxes reduce compound growth?
Taxes reduce compound growth when part of the return is paid out instead of staying invested. If less money remains in the portfolio, future returns compound on a smaller base. Over long periods, even small tax drag can create a large difference.
Is tax drag the same as fee drag?
No. Fee drag comes from investment costs such as expense ratios or management fees. Tax drag comes from taxes on income, gains or withdrawals. Both can reduce the amount of return an investor keeps.
Should I include taxes in a compound interest calculator?
If you are making a serious long-term plan, it can help to run both a pre-tax and an after-tax scenario. A simple way to approximate taxes is to lower the expected return and compare the ending values.
Do taxes matter more in a taxable account?
Usually, yes. Taxable accounts often expose the investor to annual distributions and realized gains. Tax-advantaged accounts may defer or reduce tax friction, depending on the rules of the account.
Can taxes make two similar portfolios end very differently?
Yes. If two portfolios have similar pre-tax returns but different taxable distributions, turnover or account placement, their after-tax results can diverge over time.
Does WhatIfInvested give tax advice?
No. WhatIfInvested provides educational simulations and planning tools. It does not provide legal, tax or financial advice. For personal tax decisions, consult a qualified professional.
Bottom line
Taxes on investment growth matter because the return you keep is more important than the return shown in a simple projection. A portfolio can look powerful before taxes, then become less impressive once dividends, interest, realized gains or withdrawals reduce the amount that keeps compounding. A well-built taxes on investment growth model keeps the focus on after-tax decision quality, not just a large future-value number.
The practical answer is not to overcomplicate every decision. Start with a clean projection. Then test how the plan changes when you add tax drag, fee drag and inflation drag. If the plan still works after those assumptions, it is more robust. If the plan fails, you know which part of the strategy needs attention: savings rate, account type, asset mix, costs, timeline or withdrawal expectations.
Use the Compound Interest Calculator to start with the clean math, compare related ideas with compound growth vs DCA, and move to Premium planning when the decision requires saved scenarios, exports and more realistic assumptions.