How to Backtest Your Investment Strategy Without Fooling Yourself
Test one investing idea against real history, see the drawdowns clearly, and avoid trusting a strategy just because the final number looks good.
What does it mean to backtest an investment strategy?
Backtesting is the process of applying an investment strategy to historical market data to see how it would have performed in the past. Instead of guessing whether a plan sounds smart, you define rules, apply them to real or simulated historical prices, calculate the resulting portfolio value, and compare the outcome against a benchmark such as SPY, QQQ, VT, Bitcoin, or a simple buy-and-hold portfolio.
For example, a backtest can answer questions like: what if you invested $500 every month into an S&P 500 ETF? What if you invested a lump sum at the start instead? What if you rebalanced every quarter? What if you added bonds, Bitcoin, or a Nasdaq ETF? What if your strategy looked great during bull markets but failed during crashes?
The goal is not to predict the future perfectly. A backtest is not a crystal ball. The goal is to make a strategy more visible. It helps you see the tradeoffs between return, volatility, drawdown, timing risk, contribution behavior, fees, and emotional pressure. A good backtest should make you more cautious, not overconfident.
Historical evidence
Backtesting shows how a strategy behaved across past markets, including rallies, crashes, sideways periods, and recoveries.
Decision clarity
It turns vague strategy ideas into measurable outcomes you can compare with simple alternatives.
Risk visibility
It reveals drawdowns, long recovery periods, weak regimes, and hidden assumptions before real money is committed.
Why backtesting matters for long-term investors
Many investors choose strategies based on recent performance, social media, a single chart, or a compelling story. That is dangerous because markets are noisy. A strategy can look brilliant for three years and still be fragile over a full cycle. Backtesting gives you a way to challenge the story with data.
If you are comparing dollar-cost averaging versus lump sum investing, a backtest helps you see how the answer changes by start date. If you are testing ETFs, it can show whether a high-growth fund simply benefited from one favorable period. If you are comparing crypto with equities, it can show the difference between total return and emotional difficulty. If you are saving for retirement, it can show how contributions and withdrawals change the path.
Backtesting also matters because it separates two ideas that beginners often mix together: return and experience. A strategy can have a higher final value but a brutal drawdown. Another can have a lower final value but be easier to follow. The best strategy on paper is not always the best strategy for a real human investor.
Practical takeaway: use the free Investment Simulator for quick historical tests, then move to the Premium workflow when you need multiple portfolios, fees, rebalancing, withdrawals, saved scenarios, and report exports.
Backtesting helps answer better questions
- Did this strategy outperform a simple benchmark after fees?
- Was the result driven by one unusual period or a repeatable pattern?
- How deep was the worst drawdown, and how long did recovery take?
- Would monthly investing have reduced timing risk?
- Did the strategy require behavior that most investors could not maintain?
- How sensitive were results to start date, contribution amount, and rebalancing frequency?
Where this backtesting guide fits in the simulator workflow
This guide is the central starting point for learning how to backtest an investment strategy. Once you understand the method, the next page depends on the decision you are trying to test. Use the free simulator when the question is simple, use the historical simulator guide when you need to understand market paths, and use the portfolio guide when allocation and multiple assets matter.
Run the test
Use the Investment Simulator when you are ready to test one historical scenario.
Read historical paths
Use Investment Simulator With Historical Returns to understand drawdowns, recovery and timing risk.
Compare portfolios
Use Portfolio Backtesting for Beginners when asset allocation and portfolio weights become the main decision.
Trust layer: before treating a result as decision-ready, review Are Investment Simulators Accurate? and the WhatIfInvested methodology.
How to backtest your investment strategy step by step
A useful backtest follows a repeatable process. The more specific your workflow, the less room there is for accidental curve fitting. You do not need to start with advanced code. You can begin with a calculator or spreadsheet, then move toward more advanced tools as your strategy becomes more complex.
1. Define the question
Start with one clear question. For example: “Would monthly DCA into SPY have been better than investing a lump sum over the same period?”
2. Choose the assets
Select the ETFs, stocks, crypto assets, or model portfolios you want to test. Keep the first version simple.
3. Set the time period
Include different market regimes when possible: bull markets, bear markets, high inflation periods, and recoveries.
4. Define the rules
Write down contribution frequency, rebalance rules, allocation weights, entry rules, exit rules, fees, and withdrawals.
5. Calculate results
Track final value, total invested, gain, CAGR, volatility, drawdown, benchmark comparison, and recovery periods.
6. Stress test
Change dates, fees, assets, and assumptions to see whether the conclusion survives outside the perfect scenario.
A simple backtesting example
Imagine you want to compare two strategies from the same start date. Strategy A invests $12,000 immediately into SPY. Strategy B invests $1,000 per month for 12 months, then holds. A simple backtest should not only compare final values. It should also show how painful each path was, how much cash stayed uninvested, how long the investor waited to recover from losses, and whether the result changes if the start date moves by six months.
This is why a strategy comparison guide like DCA vs Lump Sum is valuable: it helps frame the decision before you start changing assumptions. The deeper work happens when you test your own amounts, dates, assets, fees, and risk tolerance.
Data quality: the foundation of every backtest
Bad data can make a bad strategy look good or a good strategy look broken. Before trusting any result, ask where the data came from, whether it includes dividends, whether prices are adjusted for splits, whether delisted assets are missing, and whether the date range is long enough to include stressful periods.
For long-term investing, adjusted prices are usually better than raw prices because they account for dividends and splits. This matters enormously for ETFs and dividend-paying stocks. A backtest that ignores dividends may underestimate total return. A backtest that ignores fees may overestimate return. A backtest that only includes surviving companies may exaggerate historical performance.
| Data issue | Why it matters | Better practice |
|---|---|---|
| Unadjusted prices | Can ignore dividends and stock splits. | Use adjusted close or total return data when possible. |
| Short date range | May only capture one market regime. | Include multiple cycles and stress periods. |
| Missing fees | Can make high-turnover strategies look better than reality. | Add transaction costs, management fees, and spreads. |
| Survivorship bias | Removes failed assets from the historical universe. | Use historical constituents when testing stock selection strategies. |
| Look-ahead bias | Uses information that was not available at the time. | Only use data known before each simulated decision. |
For most WhatIfInvested use cases, the main question is not high-frequency trading precision. It is long-term strategy realism. That means your biggest concerns are usually total return data, dividends, contribution timing, allocation weights, fees, and whether the tested period is representative. To understand the platform's assumptions, review the WhatIfInvested methodology and the guide on how accurate investment simulators are. The SEC’s Investor.gov also warns investors to treat back-tested performance as hypothetical and to question how performance claims are calculated; see its Investor Bulletin on performance claims for a useful external reference.
Define strategy rules before you look at results
The easiest way to create a misleading backtest is to change the rules after seeing the outcome. That is why you should write down the strategy first. A proper strategy definition includes assets, weights, start date, end date, contribution amount, contribution frequency, rebalancing frequency, fees, tax assumptions, withdrawal rules, and benchmark.
For an ETF portfolio, the rules might be simple: 70% SPY, 20% QQQ, 10% bonds, monthly contribution, annual rebalancing. For a DCA strategy, the rules might include monthly contributions on the first trading day of the month. For retirement planning, the rules might include withdrawals, inflation adjustments, and a portfolio glide path.
Important: if a strategy only looks good after changing the asset, start date, end date, rebalance frequency, and benchmark many times, it may be optimized to the past rather than robust for the future.
Rules to document
- Universe: which assets are eligible?
- Allocation: what percentage goes to each asset?
- Contribution plan: lump sum, monthly DCA, biweekly DCA, or hybrid?
- Rebalancing: never, monthly, quarterly, annually, or drift-based?
- Costs: transaction fee, expense ratio, spread, and management fee.
- Withdrawals: none, fixed withdrawals, percentage withdrawals, or retirement spending.
- Benchmark: SPY, QQQ, VT, a balanced ETF, Bitcoin, or a custom portfolio.
- Success definition: higher final value, lower drawdown, better risk-adjusted return, or easier behavior.
The backtesting metrics that actually matter
Many investors only look at final value. That is a mistake. Final value tells you where the strategy ended, but it does not tell you how difficult the journey was. A serious backtest should include return metrics, risk metrics, behavior metrics, and comparison metrics.
| Metric | What it tells you | Why it matters |
|---|---|---|
| Final value | Ending portfolio value after the test period. | Useful, but incomplete without risk context. |
| Total invested | How much capital you contributed. | Necessary for understanding gain versus deposits. |
| CAGR | Annualized growth rate. | Helps compare strategies with different time periods. |
| Maximum drawdown | Worst peak-to-trough decline. | Shows emotional and capital stress. |
| Recovery time | How long it took to return to a prior high. | Important for investor patience and retirement timing. |
| Volatility | How unstable returns were. | High volatility can cause investors to abandon a plan. |
| Benchmark gap | Difference versus a simple benchmark. | Shows whether complexity added value. |
| Fee drag | How much fees reduced the final result. | Critical for active or high-cost strategies. |
A beginner-friendly backtest might only need final value, total invested, gain, and maximum drawdown. A more advanced backtest should include CAGR, volatility, Sharpe ratio, Sortino ratio, rolling returns, best year, worst year, and benchmark comparison. The more complex the strategy, the more important it becomes to measure risk properly.
Common backtesting mistakes that hurt accuracy
The biggest danger in backtesting is not that the math is difficult. The biggest danger is that you can accidentally design a test that confirms what you already want to believe. This is especially common when investors test many variations and only remember the best-looking one.
1. Optimizing the past too aggressively
If you test dozens of moving averages, rebalance rules, ETF mixes, and date ranges, one combination will almost always look excellent. That does not mean it is a good future strategy. It may simply be the version that fit the historical path best.
2. Ignoring the benchmark
A strategy can make money and still be inferior. If SPY or VT delivered similar results with less effort, lower fees, and simpler behavior, the complex strategy may not be worth it. Always compare your result to a simple alternative.
3. Ignoring cash drag
DCA strategies often hold cash before it is invested. That can reduce risk but also reduce upside during rising markets. A fair backtest should account for timing, idle cash, and contribution schedule.
4. Forgetting taxes and fees
Taxes are complicated, but fees are easy to include. Even small management fees can create meaningful differences over long periods. For high-turnover strategies, transaction costs and spreads can turn an attractive backtest into a mediocre real-world result.
5. Treating historical performance as a promise
Historical performance is evidence, not a guarantee. Markets change. Interest rates change. Valuations change. Liquidity changes. Investor behavior changes. Use backtesting to understand possible paths, not to assume the future will repeat exactly.
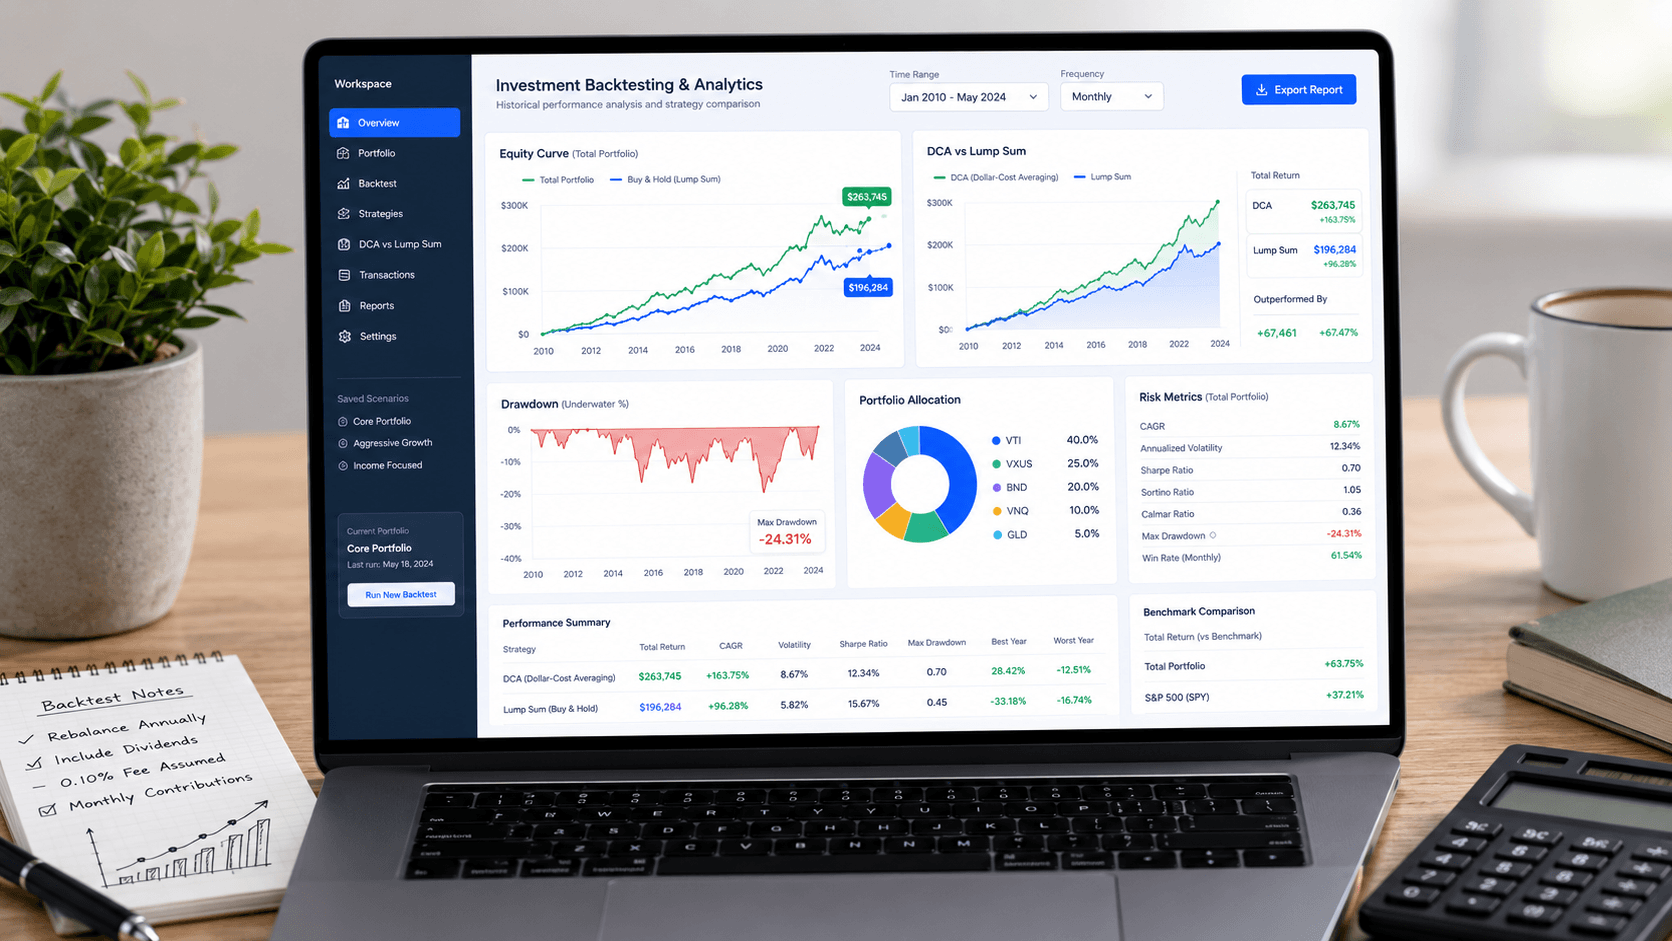
How to backtest DCA, lump sum, and portfolio strategies
Dollar-cost averaging and lump sum investing are among the easiest strategies to backtest because the rules are clear. The main difference is contribution timing. Lump sum invests all capital at once. DCA spreads contributions over time. A hybrid approach invests part immediately and the rest gradually.
When you backtest DCA, make sure the comparison is fair. If one strategy invests $12,000 immediately and another invests $1,000 per month for 12 months, the timing of exposure is different. Lump sum usually has more market exposure earlier, which helps in rising markets and hurts when a decline happens immediately after investing. DCA reduces timing risk but can underperform when markets rise quickly.
DCA backtest
Best for testing recurring contributions, paycheque investing, retirement saving, and investor discipline.
Lump sum backtest
Best for testing windfalls, bonus investing, inheritance decisions, and opportunity cost.
Portfolio backtest
Best for comparing asset allocation, ETF mixes, rebalancing rules, drawdowns, and diversification.
For related examples, read DCA vs Lump Sum: Which Strategy Wins Over Time?, What If You Had Invested in the S&P 500 Every Month?, What If You Had Invested in SPY During Every Market Crash?, and How to Simulate a Retirement Plan with DCA.
Best tools for backtesting investment strategies
The right tool depends on your level. Beginners should start with guided calculators and visual simulators. Intermediate users can use spreadsheets. Advanced users can use Python, APIs, and custom backtesting frameworks. The best tool is the one that helps you test assumptions without hiding the logic.
| Tool type | Best for | Limitation |
|---|---|---|
| Investment simulator | Fast DCA, lump sum, and historical comparisons. | Usually less flexible than code. |
| Spreadsheet | Transparent calculations and custom assumptions. | Can become fragile with large datasets. |
| Python/R | Advanced rules, automation, large datasets, and testing. | Requires coding skill and careful validation. |
| Premium workflow | Multiple portfolios, fees, rebalancing, withdrawals, exports, and saved scenarios. | Designed for long-term strategy simulation, not high-frequency trading. |
Start with the free Investment Simulator if you want a quick historical test. Use the DCA Calculator if your main question is recurring contribution growth. Use the Calculators hub when you are not sure which tool fits the decision. Use the Premium workflow when you want a more serious comparison with multiple portfolios, fees, rebalancing, withdrawals, saved scenarios, and exportable reports.
How to interpret a backtest without overreacting
The most important part of backtesting is not running the calculation. It is interpreting the result correctly. Many investors see a higher final value and immediately assume they have found a better strategy. That is not enough. You need to ask whether the strategy was better in a way that matters to your actual life.
A strategy that wins by a small amount but creates a much larger drawdown may not be worth the extra stress. A strategy that only wins during one specific period may not be robust. A strategy that requires perfect timing, frequent trades, and constant monitoring may be unrealistic for a normal investor. A strategy that looks boring but performs steadily across different periods may be more useful than a dramatic strategy with fragile results.
Look for consistency, not just the best number
When you compare strategies, look for patterns across multiple time windows. If a portfolio beats the benchmark only when the backtest begins at a perfect low, be careful. If it holds up across different start dates, contribution levels, and market conditions, the evidence is stronger. This is why rolling-period analysis can be more useful than one single long chart.
For example, a Nasdaq-heavy portfolio may outperform over a decade dominated by technology stocks, but that does not automatically mean it is better for every investor. You should compare it with broader ETFs like SPY or VT, review drawdowns, and ask whether you could continue investing during a long underperformance period. Related ETF comparisons such as SPY vs QQQ can help you understand why benchmark selection matters.
Ask whether the strategy solves your real problem
A backtest should connect to a real decision. If your problem is investing a windfall, compare lump sum, DCA, and hybrid entry. If your problem is monthly investing, focus on contribution consistency, drawdown behavior, and long-term compounding. If your problem is retirement, include withdrawals, sequence risk, inflation assumptions, and asset allocation. If your problem is crypto allocation, compare volatility and drawdown, not just total return.
The best interpretation is practical: “What would this strategy have required from me emotionally, financially, and behaviorally?” If the answer is unrealistic, the strategy may not be suitable even if the backtest looks strong.
A practical WhatIfInvested workflow for backtesting
If you are using WhatIfInvested, the most effective workflow is simple: start with the broad question, run a quick scenario, then increase detail only when the decision deserves it. This keeps the process fast for casual questions while still supporting deeper analysis for serious portfolio decisions.
Step 1: Frame the decision
Decide whether you are testing monthly contributions, a lump sum, ETF selection, crypto exposure, retirement withdrawals, or portfolio allocation.
Step 2: Run a simple test
Use the simulator or calculator to compare the main strategies without too many variables. Start with one clean question.
Step 3: Add realism
Add fees, rebalancing, multiple portfolios, withdrawals, and saved scenarios when the decision becomes important enough.
For example, suppose you want to know whether to invest $20,000 immediately or over 12 months. First, use the DCA vs Lump Sum comparison to understand the framework. Then use the Investment Simulator to test historical periods. If the decision involves multiple ETFs, fees, rebalancing, and scenario saving, move to the Premium workflow.
This workflow also helps content and tool usage support each other. The articles explain the “why,” while the tools let you test the “what if.” That combination is stronger than reading theory alone or using a calculator without context.
When not to trust a backtest
A backtest becomes less trustworthy when it is too clean, too optimized, or too dependent on one perfect historical period. Real markets are messy. Any strategy that only works under narrow assumptions deserves extra skepticism.
| Warning sign | What it may mean | What to do next |
|---|---|---|
| Perfect historical curve | The strategy may be overfit to the past. | Test different dates, assets, and assumptions. |
| Huge return with no drawdown | Costs, risk, or data problems may be missing. | Review data quality and add realistic fees. |
| No benchmark comparison | You cannot tell whether complexity added value. | Compare against SPY, QQQ, VT, or a simple portfolio. |
| Only one start date | The result may be timing luck. | Run rolling windows or multiple start dates. |
| No explanation of assumptions | The result may be impossible to reproduce. | Document rules, fees, dates, weights, and contribution timing. |
A trustworthy backtest should be boring in the right way. It should clearly state what was tested, what data was used, what assumptions were made, and what the strategy failed to handle. The weaknesses are not a problem. Hidden weaknesses are the problem. For a deeper trust check, compare the result with the WhatIfInvested methodology and the simulator accuracy guide.
Advanced backtesting considerations for serious investors
Once you move beyond simple DCA and lump sum testing, the backtest needs more care. Multi-asset portfolios introduce rebalancing decisions. Retirement strategies introduce withdrawals and sequence risk. Crypto allocations introduce extreme volatility and data continuity issues. International ETFs introduce currency and tax considerations.
Rebalancing changes the result
Rebalancing can reduce risk by forcing a portfolio back to target weights, but it can also reduce returns if the winning asset keeps rising. A quarterly rebalance and an annual rebalance can produce different outcomes. A drift-based rebalance can behave differently again. If your strategy includes multiple assets, rebalancing rules should be part of the backtest, not an afterthought.
Withdrawals create sequence risk
Retirement backtesting is different from accumulation backtesting. When you are contributing, market declines can help you buy cheaper shares. When you are withdrawing, early losses can permanently damage the portfolio because you may sell assets at depressed prices. This is why retirement backtests should include drawdown timing, withdrawal frequency, and recovery analysis.
Fees compound against you
A small annual management fee may look harmless, but it compounds over decades. Transaction costs also matter if the strategy trades often. For passive ETF investing, fees may be small but still worth including. For active allocation, fees can meaningfully change the conclusion. Premium-level backtests should allow you to see the fee drag separately from the investment result.
Behavior is part of the strategy
A backtest assumes the investor followed the rules. In real life, that is often the hardest part. If a strategy requires you to keep buying during a 45% drawdown, the backtest should make that pain visible. If it requires holding a volatile asset like Bitcoin through multiple major crashes, the final return alone does not tell the full story. Read more on investor behavior in Why Most Investors Underperform the Market.
Backtesting checklist before trusting the result
Before you act on any backtest, use this checklist. It will not make the future certain, but it will reduce the chance that you are relying on a weak or misleading simulation.
- Does the backtest use the correct asset data and adjusted prices?
- Does it include dividends, splits, fees, and realistic contribution timing?
- Does it compare the strategy against a simple benchmark?
- Does it show drawdown and recovery time, not only final value?
- Does the result still look reasonable with different start dates?
- Does the strategy work across different market regimes?
- Is the strategy simple enough to follow during stress?
- Have you avoided changing rules after seeing the result?
- Does the strategy match your risk tolerance, time horizon, and cash flow?
- Would you still follow the strategy after a major loss?
Educational simulation only. Historical performance does not guarantee future results.
Frequently asked questions
What is the best way to backtest an investment strategy?
The best way is to define the rules before seeing results, use reliable historical data, include fees and contribution timing, compare against a benchmark, and evaluate both return and drawdown. A good backtest should explain the journey, not only the ending value.
Can backtesting predict future returns?
No. Backtesting cannot predict the future. It shows how a strategy would have behaved in the past under specific assumptions. Its value comes from stress testing, comparison, and risk awareness, not certainty.
How much historical data do I need?
Use as much relevant data as possible, especially if the strategy is long term. Ideally, your backtest should include bull markets, bear markets, high volatility periods, and recoveries. A strategy tested only during a recent bull market may be misleading.
Is DCA better than lump sum in a backtest?
It depends on the start date and market path. Lump sum often wins in rising markets because money is invested earlier. DCA can reduce timing risk and emotional stress when the market falls soon after the first investment. The right answer depends on the investor’s situation.
Should I use a backtest before investing?
Yes, especially for strategy comparison. A backtest can help you understand risk, drawdowns, contribution behavior, and opportunity cost. It should be one input in your decision, not the only reason you invest.
What is the difference between a backtest and a projection?
A backtest applies rules to historical data. A projection estimates future outcomes using assumptions such as expected return, volatility, and contributions. Backtests are evidence from the past; projections are scenario planning for the future.
Final takeaway
Backtesting is one of the most useful habits an investor can build. It forces you to define assumptions, compare alternatives, and look beyond headline returns. Done poorly, it can create false confidence. Done carefully, it can help you build a strategy that is easier to understand, easier to follow, and easier to improve.
The key is to stay humble. A backtest is not a promise. It is a structured way to ask better questions. If your strategy only works under perfect assumptions, it is probably not robust. If it survives multiple periods, realistic fees, benchmark comparisons, and drawdown analysis, it deserves more attention.
Start simple. Test one question. Compare it with a benchmark. Then improve the test. That process is far more valuable than chasing the perfect historical chart.