Inflation Adjusted Investment Growth
Real returns explained for long-term investors. Inflation adjusted investment growth shows what your future portfolio could be worth after rising prices reduce purchasing power. A nominal projection may look impressive, but the real question is what that future value can actually support.
Quick answer
Inflation adjusted investment growth is the growth of an investment after inflation is removed from the return. If an investment grows at 7 percent per year while inflation averages 3 percent, the real return is not 7 percent. The investor's purchasing power grows closer to 3.9 percent per year, because the future dollars buy less than today's dollars.
This distinction matters because a projection can be mathematically correct and still feel disappointing in real life. A portfolio might reach $1,000,000 in nominal dollars, but if prices also doubled during the same period, the real spending power is closer to $500,000 in today's money. That is why serious long-term planning should compare nominal value, real value, contributions, fees, and inflation together.
What inflation adjusted investment growth really means
Inflation adjusted investment growth measures investment progress in real purchasing power rather than just future dollars. The difference is simple but powerful. Nominal growth tells you the account balance printed on the statement. Real growth tells you what that balance can buy after inflation has changed prices.
For example, if a portfolio grows from $100,000 to $200,000 over a long period, the nominal gain is easy to see. The account doubled. But if groceries, rent, healthcare, travel, insurance, education, and everyday services also became much more expensive, the investor may not feel twice as wealthy. The account balance rose, but the cost of life rose too. Inflation adjusted investment growth asks whether the portfolio outpaced that rising cost of life.
This is not a minor technical detail. It changes how investors interpret retirement targets, monthly contribution plans, DCA strategies, college savings, down payment goals, and long-term wealth projections. A future value calculator can show a clean number, but that number is incomplete unless you understand the inflation assumption behind it.
Investors often make the mistake of treating every future dollar like today's dollar. That is emotionally satisfying because the projected number looks larger. It also creates false confidence. A 30-year plan with a 7 percent nominal return may look strong, but if inflation averages 3 percent, the real path is much slower. The portfolio is still growing. It is just not growing as fast in purchasing power as the headline return suggests.
The goal is not to predict inflation perfectly. Nobody can do that. The goal is to make better decisions by separating three questions: how much the portfolio may grow, how much prices may rise, and how much real flexibility the investor may have in the future. Once those questions are separated, the plan becomes easier to test.
Nominal vs real returns: the core difference
A nominal return is the investment return before adjusting for inflation. A real return is the return after inflation. If your portfolio earns 8 percent and inflation is 3 percent, your real return is not simply the emotional feeling of earning 8 percent. Your purchasing power grew by less than the account statement suggests.
The exact real return formula is: real return = ((1 + nominal return) / (1 + inflation rate)) - 1. In plain English, you divide the investment growth by the price growth. This is more accurate than subtracting inflation directly, especially over longer periods. Subtracting 3 from 8 gives a rough estimate of 5 percent. The precise real return is about 4.85 percent.
That difference looks small in a single year. Over decades, it compounds. This is why inflation adjusted investment growth belongs in serious planning. It is not just an economics concept. It is a compounding concept. Inflation compounds against your purchasing power while returns compound for your portfolio. The useful plan is the one that compares both curves.
How to calculate inflation adjusted investment growth
The cleanest way to estimate inflation adjusted investment growth is to convert the nominal return into a real return, then run the projection with the real return. This gives a future value stated in today's purchasing power. It is not perfect, because real markets move year by year and inflation changes over time, but it is a useful planning shortcut.
Start with the nominal return assumption. This might be 5 percent, 7 percent, 8 percent, or another number based on the asset mix you are modeling. Then choose an inflation assumption. Many investors use a conservative long-term estimate such as 2.5 percent or 3 percent, but the right assumption depends on the country, period, and personal expenses. A household with high housing, healthcare, or education exposure might feel inflation differently than the official index.
You can review official inflation measurement through the Bureau of Labor Statistics Consumer Price Index resource. The CPI is not a personal budget, but it is a credible reference point for understanding how inflation is tracked in the United States.
| Planning input | Nominal view | Inflation-adjusted view | Why it matters |
|---|---|---|---|
| Return | 7.0% | 3.9% real return with 3.0% inflation | The real compounding rate is lower than the headline return. |
| Future value | $761,000 | About $314,000 in today's purchasing power | The target may need to be higher than it first appears. |
| Monthly contribution | $500 | $500 may need to rise over time | Fixed contributions can shrink in real terms. |
| Goal planning | Reach a dollar number | Reach a lifestyle or purchasing-power number | The real goal is what the money can do. |
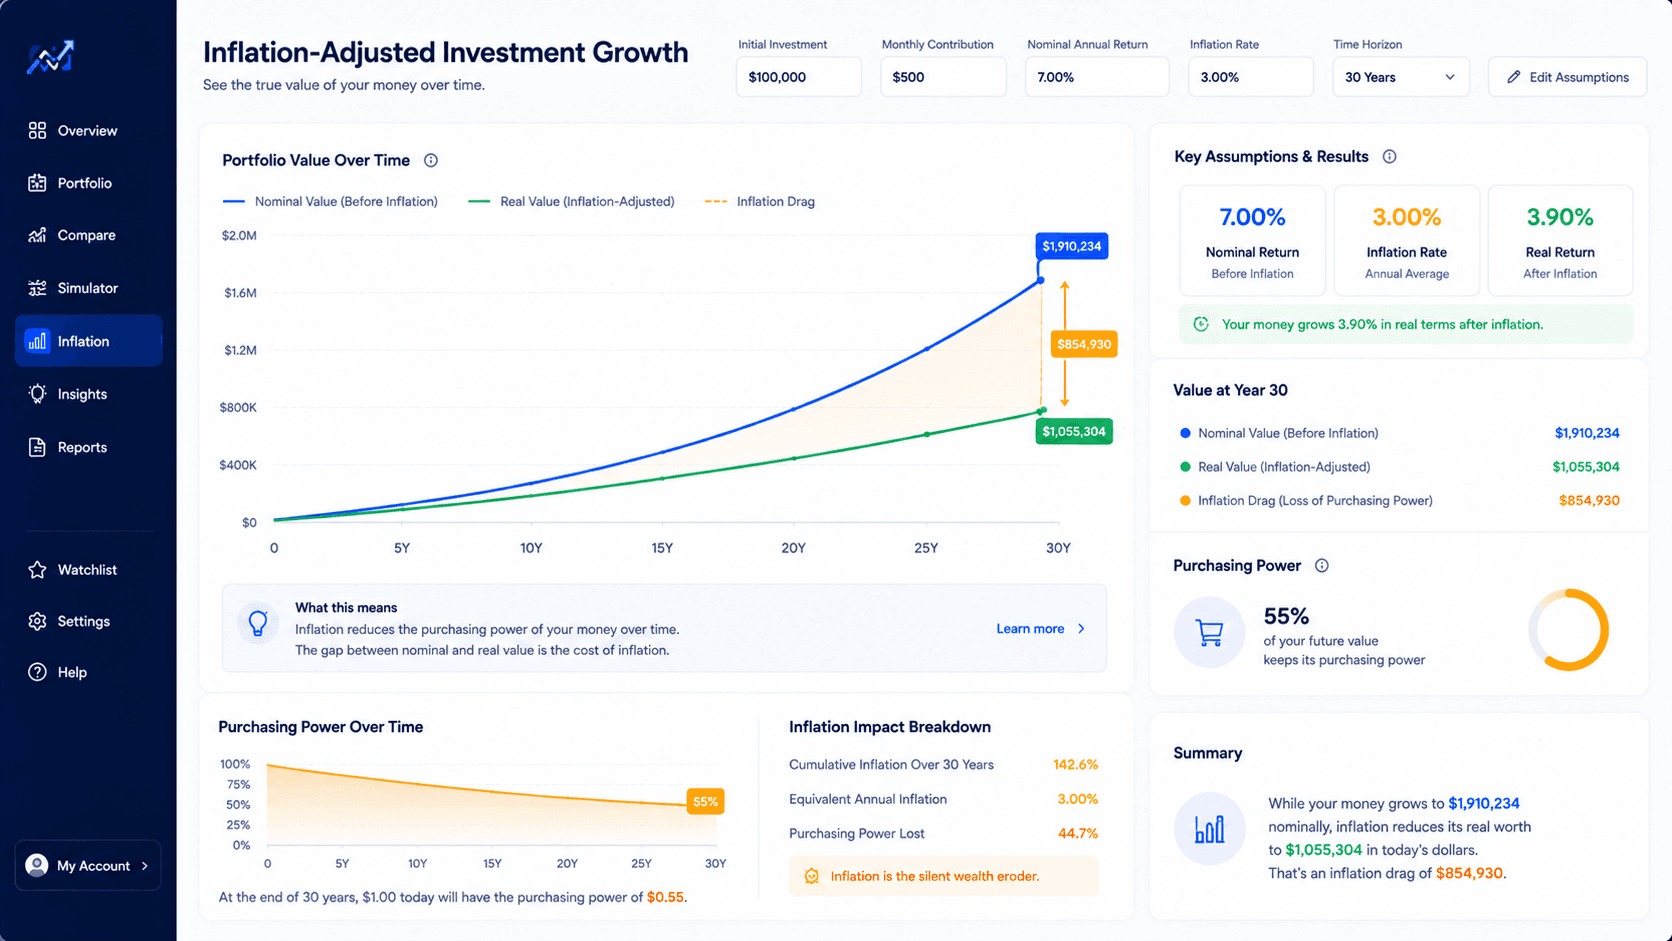
A practical example: why the same portfolio can tell two stories
Imagine an investor starts with $100,000 and invests for 30 years. The nominal return assumption is 7 percent per year. Without inflation, the projection looks excellent. The future value is around $761,000. That is a large number, and it can make the plan feel very strong.
Now add 3 percent inflation. In real terms, the annual growth rate is closer to 3.9 percent. The same portfolio may feel closer to about $314,000 in today's purchasing power. The account still grew. The investor still made progress. But the real value story is different from the nominal value story.
This is the heart of inflation adjusted investment growth. It does not say investing is useless. It says the investor should not confuse a bigger future number with an equal increase in lifestyle power. If your goal is retirement income, financial independence, tuition planning, or a future down payment, real purchasing power is the measurement that matters most.
There is also a behavioral benefit. When you see the real value, you are less likely to stop planning at the first attractive projection. You may decide to contribute more, invest longer, reduce fees, diversify better, or compare a DCA plan with a lump sum plan. The point is not pessimism. The point is clearer decision-making.
Monthly contributions change the real return story
Inflation adjusted investment growth becomes even more useful when the plan includes monthly contributions. A lump sum projection asks what one balance can become. A contribution plan asks what repeated deposits can become. Inflation affects both the future portfolio value and the real value of the contributions themselves.
A fixed $500 monthly contribution is simple to model. It is also easy to misunderstand. If the investor contributes $500 every month for 25 years, the nominal contribution stays the same. But the real value of that contribution falls over time if income and contribution size do not rise with inflation. In year one, $500 may feel meaningful. In year twenty, it may buy far less.
That does not mean fixed contributions are bad. They are often the best starting point because they build the investing habit. But for long-term planning, it is useful to ask a second question: should contributions rise over time? A plan that increases contributions with income or inflation may preserve more real saving power than a flat contribution schedule.
This is where the compound interest with monthly contributions guide fits naturally. That article owns the mechanics of recurring deposits. This article owns the inflation lens. Together, they help the user understand both the growth engine and the real purchasing-power result.
For investors comparing entry strategies, the same logic connects to DCA. A DCA plan may reduce timing stress, but it should still be evaluated in real terms. If contributions are too small relative to the goal and inflation, the plan can be disciplined and still underfunded. That is why a calculator should be used as a decision tool, not only a motivational number machine.
How to use WhatIfInvested tools for real growth planning
The simplest workflow starts with the Compound Interest Calculator. Use it first to test a base case: starting balance, monthly contribution, timeline, and expected nominal return. Then run a second version using an estimated real return. This lets you compare the headline future value with the inflation-adjusted planning value.
For example, if your nominal return assumption is 7 percent and inflation is 3 percent, run one scenario at 7 percent and one at about 3.9 percent. The difference between the two outputs is the purchasing-power gap. That gap is not an error. It is the cost of inflation over time.
After that, use the Investment Simulator when you want historical context. A compound calculator uses a smooth return assumption. Real markets do not move smoothly. A simulator helps you see whether an ETF, stock, or crypto asset went through crashes, long flat periods, recoveries, and volatility. It does not predict the future, but it can make the path more realistic.
Use the DCA Calculator when the main question is recurring investing. DCA planning is useful when money arrives gradually through income, but it still needs an inflation lens. A contribution plan that looks comfortable in nominal terms may need a higher monthly amount to protect future purchasing power.
For deeper planning, compare the result with the investment fees compound growth guide. Inflation is not the only drag. Fees also compound against the investor. A plan that loses purchasing power to inflation and loses return to unnecessary fees can require much higher contributions than expected.
Free vs Premium workflow
The free workflow is enough when you need a quick projection, a first inflation-adjusted estimate, or a simple recurring contribution test. Start with the Compound Interest Calculator, then compare the result with the Investment Simulator when you want historical context.
Premium becomes more relevant when the decision needs saved scenarios, multiple assumptions, exports, deeper comparisons, or a repeatable planning workspace. If you want to compare nominal growth, inflation adjusted investment growth, fees, DCA behavior, benchmark results, and different portfolio allocations in a more organized workflow, the Premium layer is the natural next step.
The practical funnel is simple: learn the concept, run the free calculator, compare the assumptions, then upgrade when the plan becomes important enough to save, export, and revisit. You can review Premium access on the Pricing page.
Common mistakes when modeling inflation adjusted investment growth
Using nominal projections as lifestyle targets
The first mistake is treating a future dollar amount as if it has today's purchasing power. A $1,000,000 target may be meaningful, but the real question is what that amount can buy at the time you need it. Retirement planning, education planning, and long-term independence goals should all account for inflation.
Ignoring contribution inflation
Many investors model a flat monthly contribution for decades. That is a useful starting point, but it may understate what the plan needs if income rises and expenses rise. When possible, test a higher contribution path or revisit the plan annually.
Forgetting fees
Inflation reduces purchasing power. Fees reduce investment compounding. Both effects matter. A low-fee portfolio cannot eliminate inflation, but it can help more of the market return remain available to fight inflation.
Using one inflation assumption forever
Inflation can be low for years, then high for a period, then settle again. A single assumption is a planning tool, not a promise. Good planning tests several versions: moderate inflation, higher inflation, and lower real returns.
Confusing real return with guaranteed return
A real return estimate is not a forecast. It is an assumption. Markets can underperform, outperform, crash, recover, or remain flat. The inflation-adjusted view improves clarity, but it does not remove uncertainty.
Real return scenarios worth testing
A useful inflation adjusted investment growth workflow should not rely on one clean forecast. The better approach is to create a small range of scenarios. This helps you see whether the plan only works under optimistic assumptions or whether it still works when inflation is higher, returns are lower, or contributions rise more slowly than expected.
Start with a base case. A base case might use a 7 percent nominal return and 3 percent inflation. This is not a promise. It is a reference point. Then create a conservative case. For example, use a 5 percent nominal return and 3.5 percent inflation. Finally, create an optimistic but still reasonable case. You might test an 8 percent nominal return and 2.5 percent inflation. The goal is not to guess the future perfectly. The goal is to understand how sensitive the plan is to inflation and return assumptions.
This matters because two plans can look similar in nominal terms but behave very differently in real terms. A plan that reaches the target only when inflation stays low may be fragile. A plan that still works under moderate inflation and lower returns is more resilient. When you compare scenarios, focus less on the biggest final number and more on the range of possible purchasing-power outcomes.
For a young investor, the most important sensitivity may be contribution growth. If income rises over time, increasing contributions can offset some inflation pressure. For someone near retirement, the most important sensitivity may be withdrawal power. The same portfolio value can support very different spending levels depending on inflation during retirement. For someone saving for a home, the key sensitivity may be local housing inflation, which can move faster than broad consumer inflation.
How asset allocation changes inflation-adjusted outcomes
Inflation adjusted investment growth is not only a calculator setting. It is also connected to asset allocation. Cash, bonds, broad stock ETFs, dividend strategies, real assets, and growth assets can respond differently to inflation and interest rate environments. That does not mean one asset is always best. It means the real-return question should be connected to the portfolio design.
Cash can feel safe because the nominal balance does not fall much. But if inflation is higher than the interest earned, the real value of cash declines. Bonds can provide income and stability, but their real return depends on yields, inflation, and interest rate changes. Broad equity ETFs can offer long-term growth potential, but they bring volatility. Growth stocks may have strong upside, but their valuations can be sensitive to interest rates. Crypto can produce extreme nominal returns in some windows, but its volatility can make real planning harder.
The practical lesson is not to chase the asset that performed best last year. It is to understand the job each asset has in the plan. A retirement portfolio may need growth, stability, income, and liquidity. A 25-year accumulation portfolio may prioritize real growth. A short-term down payment fund may prioritize preserving nominal capital even if real growth is limited. Different goals deserve different assumptions.
This is where inflation adjusted investment growth connects to the broader WhatIfInvested ecosystem. The Compound Interest Calculator helps you test the math. The Investment Simulator helps you test historical paths. The Premium planning workflow is useful when the decision involves several portfolios, saved scenarios, exports, and comparisons that you want to revisit later. The stronger the decision, the more important it becomes to compare more than one asset mix.
| Asset type | Inflation question | Planning risk | Useful next test |
|---|---|---|---|
| Cash | Is yield higher than inflation? | Purchasing power erosion | Compare nominal safety with real loss. |
| Bonds | Do yields compensate for inflation? | Rate sensitivity and real income risk | Test lower real return assumptions. |
| Broad ETFs | Can growth outpace inflation over decades? | Volatility and long recovery periods | Run a historical simulator scenario. |
| Growth assets | Is the upside worth the volatility? | Large drawdowns and uncertain timing | Compare real CAGR and drawdown together. |
How to translate real growth into a better goal
The best use of inflation adjusted investment growth is not just to lower a projection. It is to improve the goal. Instead of asking, "Can I reach $1,000,000?", ask, "What future amount would equal the lifestyle power I want?" Those are different questions. The first is a number. The second is a decision.
Suppose a household wants the future equivalent of $60,000 per year in today's purchasing power. If retirement is 25 years away and inflation averages 3 percent, the nominal spending need could be much higher than $60,000. The portfolio target also has to be higher. That does not mean the goal is impossible. It means the target should be translated into future dollars and then tested with realistic investment assumptions.
This kind of planning also helps with motivation. A large nominal target can feel abstract. A real purchasing-power target feels more concrete. It connects the portfolio to actual decisions: rent or mortgage flexibility, travel, healthcare margin, education, family support, business risk, or the ability to work less. A real goal is easier to evaluate because it is tied to what the money is supposed to do.
For users building a serious plan, the most useful process is iterative. Pick a real goal. Convert it into a future nominal target. Test the contribution amount. Compare a conservative and a base case. Check whether fees are dragging the result. Then test historical paths if the asset mix depends on volatile markets. This is how a simple projection becomes a decision workflow.
A simple workflow for inflation adjusted investment growth
Use this sequence when you want a clean, practical process. First, model the nominal result. This gives you the standard future value. Second, estimate the real return by adjusting the nominal return for inflation. Third, model the same plan using the real return. Fourth, compare the two outcomes. Fifth, adjust the contribution, timeline, or return assumption until the plan makes sense in purchasing-power terms.
After that, widen the analysis. Add fee drag. Compare DCA and lump sum if the timing of cash matters. Use historical simulation when the path matters. Review the plan again when income, expenses, asset allocation, or inflation expectations change. A good plan is not a frozen prediction. It is a system that can be updated as the facts change.
This workflow keeps the user focused on decision quality. The output is not merely a bigger or smaller number. The output is a clearer next action. Maybe the contribution should increase. Maybe the timeline should be longer. Maybe the expected return is too optimistic. Maybe the portfolio needs more diversification. Maybe the plan is already strong enough, and the main improvement is to save the scenario and revisit it annually.
Internal links for the next decision
If your next question is about a clean future-value projection, use the Compound Interest Calculator. If your next question is about monthly deposits, read the monthly contributions guide. If your next question is whether recurring investing or a one-time investment fits better, compare compound growth vs DCA.
If the plan already feels serious, compare inflation with fee drag, because both can change the result. The investment fees compound growth article shows why small costs can become large over decades. If you want to test the path with real historical market data, use the Investment Simulator.
FAQ about inflation adjusted investment growth
What is inflation adjusted investment growth?
Inflation adjusted investment growth is investment growth measured after inflation is removed. It shows how much purchasing power the portfolio may have in today's dollars instead of only showing a future nominal balance.
How do I calculate inflation adjusted investment growth?
Use the real return formula: ((1 + nominal return) / (1 + inflation rate)) - 1. Then use that real return in a compound interest calculator to estimate future value in today's purchasing power.
Is a real return calculator better than a normal investment calculator?
It depends on the question. A normal calculator is useful for nominal future value. A real return calculator or inflation-adjusted workflow is better when you care about purchasing power, retirement income, or long-term lifestyle goals.
What inflation rate should I use for investment planning?
Many investors test 2.5 percent to 3 percent as a long-term assumption, but it is smart to run multiple scenarios. Higher inflation assumptions create a more conservative view of future purchasing power.
Does inflation affect monthly contributions?
Yes. A fixed contribution loses purchasing power over time if it never increases. A $500 monthly contribution today may feel much smaller in real terms after many years of inflation.
Should I use nominal returns or real returns for retirement planning?
Use both. Nominal returns show the account balance you might see in the future. Real returns show what that balance may buy. Retirement planning is usually stronger when it includes a real-return view.
Can inflation adjusted investment growth be negative?
Yes. If the portfolio return is lower than inflation, purchasing power falls even if the account balance rises slightly. This can happen with cash, low-yield assets, or weak market periods.
Bottom line
Inflation adjusted investment growth gives the investor a cleaner view of progress. It does not replace nominal projections, and it does not predict the future. It simply answers a more useful question: after prices rise, what is the plan really worth?
Start with a nominal projection, convert it into a real-return version, compare the gap, then decide whether the contribution amount, timeline, asset mix, or Premium planning workflow needs to change. The goal is not a bigger spreadsheet number. The goal is a plan that can still work in real life.