Investment Fees Compound Growth: How Costs Reduce Returns
Investment fees compound growth in the wrong direction. A small expense ratio or advisory fee can quietly reduce today’s balance, tomorrow’s returns and the long-term gap between two investors who started with the same plan.
Quick answer: investment fees compound growth drag
Investment fees compound growth drag over time because every dollar paid in fees is a dollar that no longer stays invested. The cost is not only the fee charged this year. The larger cost is the future growth that fee could have earned if it had remained in the account.
A 0.25% expense ratio may look harmless on a single statement. A 1.00% advisory fee may feel small compared with a 7% expected return. But over 20 or 30 years, investment fees compound growth drag by reducing the amount available to compound. The longer the timeline, the larger the hidden opportunity cost.
The practical rule is simple: compare investment results after fees, not before fees. A strategy with a slightly lower headline return and much lower costs can beat a more expensive strategy because more of the return stays invested.
Why small fees become large over time
Fees are easy to underestimate because they are usually shown as small percentages. A 0.10% fund expense ratio, a 0.25% platform fee or a 1.00% advisory fee does not feel dramatic in isolation. The investor sees a number that looks much smaller than the expected market return. That framing is the problem. Fees do not happen once. They repeat, and they repeat inside a system that depends on compounding.
Compound growth is powerful because each year’s gains can become part of the base that earns future gains. If an account grows from $100,000 to $107,000, the next year starts from $107,000 instead of $100,000. Over many years, that reinvested growth creates a widening curve. Fees interrupt that process. They reduce the balance before the next compounding period begins.
This is why investment fees compound growth drag more aggressively than many people expect. A one-year fee is not just a one-year cost. It lowers the base for every year that follows. If the fee removes $500 this year, that $500 cannot earn returns next year, the year after that, or twenty years later. The lost growth on the fee becomes part of the real cost.
The difference becomes especially visible when two investors use similar portfolios with different costs. Investor A uses a low-cost ETF portfolio. Investor B uses a higher-cost fund or advisory structure. If both earn the same gross market return, Investor A keeps more of the return each year. The annual difference may seem small at first. After decades, the gap can become large enough to change retirement income, savings targets or the amount needed from monthly contributions.
That does not mean every fee is bad. It means every fee should be understood. A fee that buys planning, tax guidance, behavior coaching or a valuable workflow may be reasonable. A fee that adds complexity without improving decisions is much harder to justify. The key is to compare investment fees compound growth impact, the net result and the decision value, not only the percentage.
The two ways investment fees compound growth costs
There are two separate effects to understand. The first effect is direct. The fee is taken from the portfolio, so the investor owns less. If a $100,000 portfolio pays 1% in annual fees, the direct cost is $1,000 for that year. This is the visible cost.
The second effect is indirect. That $1,000 no longer compounds. If the portfolio might have earned 7% per year, the lost $1,000 could have become more than $1,900 after ten years, more than $3,800 after twenty years and more than $7,600 after thirty years. This is the invisible cost. Most investors notice the direct cost, but the invisible cost is often what creates the largest long-term difference.
This is why fee analysis belongs inside compound growth planning. A calculator that only shows future value before fees can make an expensive plan look better than it really is. A better workflow compares gross return, net return and the final value gap. That is the difference between seeing a projection and seeing an investment fees compound growth decision.
| Fee effect | What happens | Why it matters |
|---|---|---|
| Direct fee | Money leaves the portfolio this year. | It immediately lowers account value. |
| Lost compounding | The paid fee no longer earns future returns. | This creates a growing opportunity cost. |
| Lower net return | Gross return is reduced by recurring costs. | The long-term curve becomes flatter. |
| Higher contribution need | The investor may need to add more to reach the same goal. | Fees can change savings targets. |
A useful way to think about this is that fees create a headwind. The portfolio can still grow, but it has to overcome the headwind every year. A low fee creates a small headwind. A high fee creates a larger one. The problem is not that a single year is ruined by a fee. The problem is that the investment fees compound growth headwind is always there.
For a deeper primer on projections, use the compound interest with monthly contributions guide. If you are deciding whether the question is a projection, DCA plan or historical simulation, use Compound Growth vs DCA.
Expense ratios, management fees and investment fees compound growth
Not all investment fees appear in the same place. Some are embedded inside funds. Some are charged by advisors. Some are charged by platforms, robo-advisors or account providers. Some are transaction costs that appear only when you buy or sell. To compare investment fees compound growth drag fairly, the investor has to understand which costs are recurring and which costs are one-time.
An expense ratio is the ongoing cost of owning a fund or ETF. If a fund has a 0.20% expense ratio, the cost is built into the fund’s net return. The investor usually does not receive a separate bill. That makes the fee easy to ignore, but it still reduces returns.
A management fee or advisory fee is often charged as a percentage of assets. A 1.00% advisory fee on a $250,000 portfolio is $2,500 per year before considering fund expenses. If the advisor uses funds with their own expense ratios, the total cost may be higher than the headline advisory fee.
Platform fees and subscription fees can matter too. A flat monthly subscription may be modest for a large account but expensive for a small account. For example, a $10 monthly platform cost is $120 per year. On a $12,000 account, that is effectively 1%. On a $120,000 account, it is 0.10%. The same dollar fee has a different impact depending on account size.
For public education, the most important distinction is recurring versus one-time. A one-time trading fee can be annoying, but a recurring annual fee compounds against the investor. A recurring fee deserves more attention because it repeats automatically. That is why expense ratios and advisory fees should be included when comparing long-term projections.
Example: 0.03% vs 0.75% vs 1.00% fees
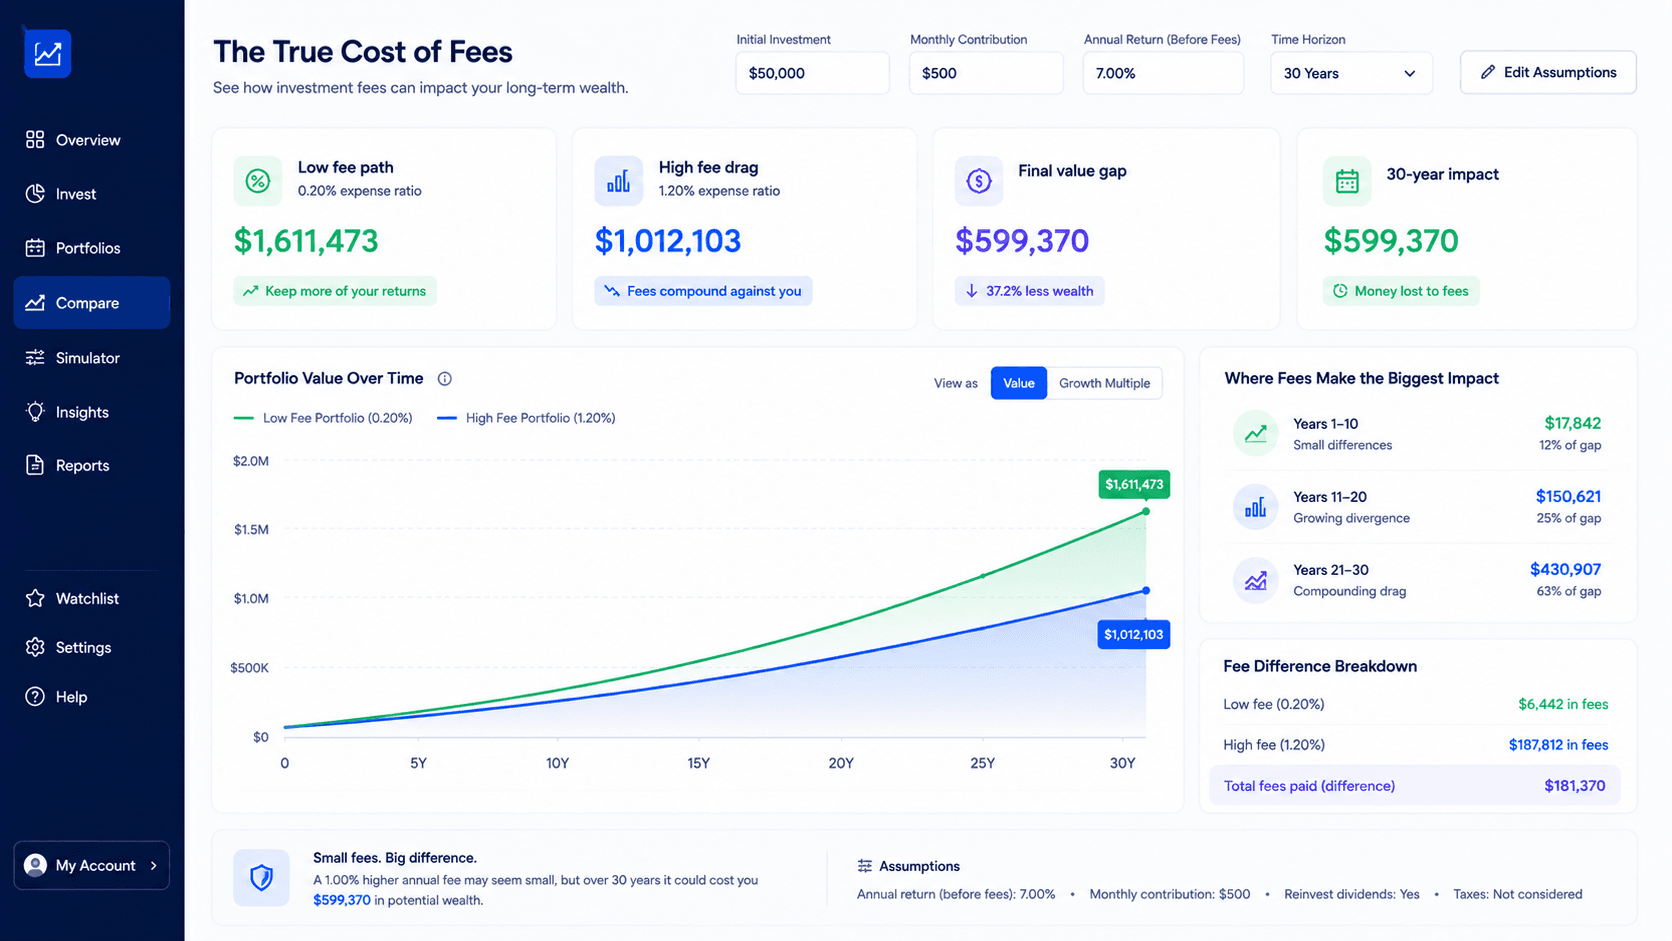
Imagine three investors each starts with $50,000 and contributes $500 per month for 30 years. They all expect the same gross return before fees. The only difference is cost. One uses a very low-cost fund at 0.03%. One uses a moderate all-in cost of 0.75%. One pays 1.00% annually. This is the simplest investment fees compound growth comparison because every other input stays the same.
At the beginning, the difference is easy to dismiss. In year one, the low-cost path and the high-cost path may not look dramatically different. The investor may think, “The market return matters much more than the fee.” That is partly true in the short term. Over decades, the fee becomes part of the compounding equation.
The 1.00% fee does not subtract only 1% once. It lowers the net return every year. If the gross return assumption is 7%, the low-cost portfolio might keep almost the whole return, while the 1% fee portfolio compounds closer to 6% before any other friction. That one-point investment fees compound growth difference can create a large final value gap because the account is growing for a long time and because monthly contributions are constantly being added to the fee base.
| Cost level | What it represents | Long-term interpretation | Decision signal |
|---|---|---|---|
| 0.03% | Ultra-low-cost broad ETF | Most return stays invested. | Hard benchmark for passive exposure. |
| 0.25% | Low-cost platform or fund mix | Still relatively efficient. | Can be reasonable if workflow value is clear. |
| 0.75% | Moderate advisory or fund cost | Fee drag becomes visible over decades. | Needs a clear planning or behavior benefit. |
| 1.00%+ | Traditional advisory or expensive structure | Long-term gap can become substantial. | Must justify itself through value beyond returns. |
The right comparison is not “is 1% small?” The right question is “what does 1% cost over the full investing horizon?” That question changes the decision. It forces the investor to compare the final value gap, the contribution required to offset the gap and the non-investment value received in exchange for the fee.
This is also where a historical simulator can help. A future-value calculator can model smooth assumptions, while the Investment Simulator can show how real market paths behaved. If you want to compare multiple strategies rather than one projection, use How to Compare Investment Strategies.
How investment fees compound growth in monthly plans
Fees matter even more when the investor contributes regularly. Monthly contributions increase the amount exposed to future fees. That does not mean regular investing is bad. It means the cost structure should be part of the plan from the beginning.
Consider a person contributing $500 per month for 25 years. The investor may focus on the contribution amount, expected return and time horizon. Those are important inputs. But if the projection ignores fees, the expected future value may be too optimistic. A realistic plan should ask what the portfolio might become after ongoing costs.
The fee can also change the required monthly contribution. If a low-cost path reaches the target with $500 per month, a higher-cost path may require $540, $575 or more per month to reach the same goal, depending on the assumptions. That is one of the most practical ways to explain fee drag. It turns an abstract percentage into a monthly cash-flow decision.
For example, a 1% fee may not feel important when someone is only reading fund documents. But if the calculator shows that the same goal requires an extra monthly contribution for 20 years, the investment fees compound growth cost becomes easier to understand. The investor sees the fee as a real planning tradeoff, not a technical detail.
If your main question is about recurring deposits, compare this article with DCA calculator with monthly contributions. If the plan is more about smooth future-value projection, start with the Compound Interest Calculator.
How to model investment fees compound growth drag
The easiest way to understand fee drag is to run two versions of the same plan. Keep the starting balance, contribution, time horizon and gross return the same. Change only the fee assumption. This isolates the fee and prevents the comparison from becoming confused by unrelated variables.
Start with a baseline scenario. For example, use a 7% expected return and no fees. Then create a second scenario with a 0.25% cost, a third with a 0.75% cost and a fourth with a 1.00% cost. The final value gap between the scenarios is the approximate cost of fees under those assumptions.
Next, compare the annual path. A high-fee portfolio may not look much worse in the early years. The gap usually becomes more visible later because the fee has had more time to reduce the compounding base. This is why a 30-year view can be more revealing than a 5-year view.
Finally, compare the result to a goal. If the investor needs $1,000,000, ask whether the higher-fee path still reaches the goal. If it does not, estimate the additional monthly contribution required. This turns investment fees compound growth analysis into a planning decision. The goal is not to shame every fee. The goal is to understand what the fee requires from the investor.
| Step | Input to keep constant | Input to change | What to review |
|---|---|---|---|
| 1 | Starting balance, contribution, years | No fee | Baseline future value |
| 2 | Same plan | 0.25% fee | Low-cost drag |
| 3 | Same plan | 0.75% fee | Moderate-cost drag |
| 4 | Same plan | 1.00% fee | High-cost gap |
| 5 | Same goal | Contribution required | Cash-flow impact |
This process also fits naturally into the broader WhatIfInvested workflow. Use the free calculator to understand the basic math. Use the simulator when market history matters. Use pricing when the analysis becomes repeatable and you need saved scenarios, fee settings, exports or decision reports.
When investment fees compound growth matters most
Low fees matter most when the investment exposure is easy to get cheaply. Broad market ETFs are the clearest example. If an investor wants simple U.S. market, global equity or broad bond exposure, there are often low-cost options. In that case, paying a high recurring fee for the same exposure needs a strong justification.
Low fees also matter more when the time horizon is long. A 25-year-old investing for retirement may experience decades of compounding. A fee that looks small today has a long time to create opportunity cost. The same fee may matter less for money needed in two years, because there is less time for the lost compounding effect to expand.
Account size matters too. Percentage-based fees become more expensive as the account grows. A 1% fee on $20,000 is $200 per year. A 1% fee on $800,000 is $8,000 per year. The same percentage can feel different once the portfolio becomes large. That is why investors should revisit fees as their assets grow.
Low fees are especially important when the investor is comparing similar portfolios. If two portfolios hold nearly the same assets, similar allocations and similar risk, the lower-cost version has a natural advantage. The higher-cost version must provide value through something other than the holdings themselves. This is where investment fees compound growth analysis protects the decision from marketing language.
When higher investment fees compound growth tradeoffs may be acceptable
Fee minimization is not the same as good planning. Sometimes a higher fee can be acceptable if it clearly improves the investor’s outcome or behavior. The key word is clearly. The fee should buy something that matters.
An advisor may help with tax planning, retirement decisions, estate coordination, withdrawal strategy, insurance analysis or behavioral coaching. A planning platform may help organize scenarios, export reports, compare assumptions and keep decisions documented. A specialized strategy may provide exposure that is difficult to replicate cheaply. Those benefits can have value.
The mistake is paying a high recurring fee without knowing what the fee buys. If the investor is only receiving a generic portfolio that could be built with low-cost funds, the fee deserves scrutiny. If the fee helps the investor avoid panic selling, optimize taxes, coordinate accounts or make better decisions, the investment fees compound growth tradeoff may be more defensible.
This is why the comparison should include both math and workflow. A spreadsheet can show fee drag. A decision process can show whether the investor receives value for that drag. WhatIfInvested’s premium logic fits this distinction: the goal is not to make the user pay for a single number. The goal is to support repeatable planning, saved scenarios and clearer decisions.
Common mistakes when comparing investment fees
The first mistake is comparing gross returns instead of net returns. A fund, advisor or strategy may show attractive historical performance before all costs are considered. The investor needs to know what remains after fees, because investment fees compound growth drag is a net-return problem.
The second mistake is ignoring embedded fund expenses. If an advisory fee is 0.75% and the underlying funds cost 0.25%, the all-in recurring cost may be closer to 1.00%. The fee stack matters.
The third mistake is treating flat fees and percentage fees as the same. A flat monthly cost can be expensive for small accounts and modest for large accounts. A percentage fee scales with assets and can become much larger as the portfolio grows.
The fourth mistake is assuming lower fees always mean better outcomes. Lower costs are usually helpful, but the investor still needs the right asset allocation, time horizon, risk tolerance and behavior. A cheap strategy that the investor abandons during a crash can still fail.
The fifth mistake is not revisiting fees. A fee that made sense when the account was small may become less attractive when the balance is larger. A planning relationship that was useful during a complex life stage may need to be reviewed later. Fees should be part of the regular investment review process.
FAQ: investment fees compound growth
How do investment fees affect compound growth?
Investment fees reduce compound growth by lowering the amount that stays invested. The fee itself is a cost, and the lost future growth on that fee is an additional opportunity cost.
Is a 1% investment fee high?
A 1% annual fee can be high for simple market exposure, especially over long periods. It may be acceptable only if the investor receives clear planning, tax, behavior or workflow value that justifies the cost.
What is fee drag?
Fee drag is the reduction in investment returns caused by recurring costs such as expense ratios, advisory fees or platform fees. It becomes more visible as the time horizon grows.
Do ETF expense ratios really matter?
Yes. ETF expense ratios matter because they reduce net returns every year. The difference between a very low-cost ETF and a higher-cost fund can become meaningful over decades.
How can I calculate the impact of investment fees?
Run the same compound growth scenario with different fee assumptions. Compare final value, net return and the additional contribution needed to reach the same goal.
Should I always choose the lowest-fee investment?
Not always. Low fees are important, but the investment still needs to fit the goal, risk tolerance, diversification needs and investor behavior. Fees should be compared with the value received.
Conclusion: compare the net path, not the headline return
Investment fees compound growth drag quietly. They reduce the account today and remove the future growth that the fee could have earned. Over a short period, the difference may look small. Over decades, the gap can become one of the most important parts of the investment decision.
The best process is practical. Estimate the gross return, subtract realistic costs, compare several fee levels and review the final value gap. If the fee is high, ask what value it buys. If the value is unclear, the lower-cost path may deserve serious consideration.
Start with the Compound Interest Calculator to model the basic math. If the decision becomes a repeatable workflow with scenarios, fees, reports and portfolio comparisons, review Premium pricing.
Model fee drag before the decision becomes expensive
Run a simple projection first, then upgrade the workflow when you need saved scenarios, fee assumptions and export-ready reports.
Educational note: WhatIfInvested is for educational simulation only. Historical performance and projected returns do not guarantee future results.