Are investment simulators accurate?
Are investment simulators accurate enough to guide real investing decisions? They can be extremely useful, but they are not crystal balls. This guide explains when simulators are accurate, where they can mislead investors, and how to interpret backtests, DCA projections, Monte Carlo results, fees, dividends, inflation, taxes, and historical market data responsibly.
Are investment simulators accurate? Quick answer
Are investment simulators accurate? They are accurate when they answer the right question with clean data and transparent assumptions. They can show what would have happened if you invested in a specific asset, with a specific contribution schedule, during a specific historical period. They can also estimate future growth using assumptions such as return, volatility, fees, inflation, withdrawals, and contribution frequency.
They become less accurate when users treat the output as a prediction. A simulator can tell you how a DCA strategy performed in the past. It cannot guarantee that the same asset will behave the same way in the future. It can model a 7% annual return assumption. It cannot promise that markets will deliver 7% every year. The real value is not certainty. The real value is clarity.
Best framing: if you are asking are investment simulators accurate, think of the tool as a map, not the terrain. It helps you compare scenarios, understand tradeoffs, and test assumptions before committing real money.
On this page
What does “accurate” mean for an investment simulator?
To answer are investment simulators accurate, start with what the simulator is trying to do. A historical backtest can be accurate if it uses correct prices, dividends, splits, contribution dates, currency conversions, and fee assumptions. A future projection can be reasonable if the assumptions are realistic, but it cannot be accurate in the same way because the future has not happened yet. This distinction matters because many people confuse precision with truth.
If a simulator says a portfolio could grow to $543,212 after 30 years, that number may look exact. But it is only exact under the model’s assumptions. Change the return by one percentage point, add inflation, include advisory fees, add withdrawals, or start during a weaker market environment, and the result can change dramatically. A good simulator should make those assumptions visible, because are investment simulators accurate depends on whether the user can inspect the model.
For WhatIfInvested, the goal is not to predict the future perfectly. The goal is to help investors compare strategies. For example, you can test lump sum versus dollar-cost averaging, compare a single asset with a diversified portfolio, review drawdowns, or see how monthly contributions compound over time. That kind of comparison is useful because it turns vague investing ideas into numbers you can inspect.
Accuracy is strongest when the question is historical
If you ask “what would have happened if I invested $500 per month into SPY from a specific date?” the simulator can be very precise if the underlying data is correct. That is a backtesting question. If you ask “what will happen if I invest $500 per month for the next 30 years?” the simulator can only provide a projection. The second question is still useful, but it depends on future assumptions that may be wrong.
Accuracy scorecard
Data quality is the foundation of simulator accuracy
The most important input in any investment simulator is market data. If the data is wrong, incomplete, stale, or adjusted incorrectly, the final output can be misleading. For stocks and ETFs, the most common issue is whether the data includes dividends, stock splits, and distributions. A price-only chart can understate the long-term return of dividend-paying assets. Total return data is usually more complete for long-term comparisons.
For crypto assets, data quality has different challenges. Bitcoin and other crypto assets trade continuously, across many venues, with different liquidity conditions. Daily closing prices can vary depending on the source. Exchange outages, stablecoin liquidity, spreads, and market structure can affect historical values. The simulator does not need to capture every tick to be useful, but users should understand that crypto history is not as standardized as traditional exchange-traded securities.
Currency also matters. A Canadian investor comparing VFV, VOO, Bitcoin, Apple, or gold may care about CAD returns, USD returns, or currency-adjusted returns. If currency is ignored, the simulator may answer the wrong question. Likewise, an ETF listed in Canada may behave differently from a similar U.S.-listed ETF because of withholding tax, currency exposure, and fees.
Data frequency is another overlooked factor. Daily data is usually good enough for long-term investors, but it will not capture every intraday high or low. Monthly data can be fine for long-range planning, but it can hide drawdowns and timing details. For a DCA simulator, daily or trading-day data is usually more useful because monthly contributions need to be mapped to real market prices. For an educational simulator, the key is consistency: the same rule should be applied across assets and periods. In other words, are investment simulators accurate only when their timing rules are consistent.
Data freshness also matters for tools that use live or recently updated values. If a spreadsheet, API, or JSON feed is not updated, the simulator may still run but the latest period will be missing or stale. That is not always a problem for long-term history, but it matters if the user expects current data. A reliable simulator should clearly separate historical backtesting from forward-looking projections and current-market estimates.
For a neutral planning reference, the official Investor.gov compound interest calculator shows the same principle in a simpler form: projections depend on the inputs selected by the user. That is why are investment simulators accurate is really a question about data, assumptions, and interpretation.
| Data issue | Why it matters | What to check |
|---|---|---|
| Dividends and distributions | Price-only returns can understate compounding. | Use total return data when possible. |
| Stock splits | Unadjusted split data can distort historical prices. | Use adjusted historical prices. |
| Missing dates | Gaps can affect DCA purchases and drawdowns. | Check how non-trading days are handled. |
| Currency | USD and CAD outcomes can differ. | Match the simulation currency to your real investor context. |
| Fees and spreads | Real returns are lower after costs. | Add transaction fees, management fees, and trading friction where relevant. |
Model assumptions can change the result more than people expect
Even with perfect data, the simulator’s assumptions shape the result. A DCA calculator must decide when contributions are invested. A lump sum model must decide whether the purchase happens at the open, close, or nearest available trading day. A retirement simulator must decide how withdrawals happen, whether rebalancing occurs, and whether inflation adjusts spending. These details can matter over long periods, so are investment simulators accurate only after the assumptions are checked.
Fees are especially important. A 1% annual management fee may look small, but over decades it can reduce ending wealth significantly. Transaction fees may not matter much for a long-term lump sum investor, but they can matter for frequent small contributions, especially if the contribution amount is low. Spreads can also matter for crypto or less liquid assets.
Inflation is another major assumption. A portfolio growing from $100,000 to $300,000 sounds impressive, but purchasing power depends on inflation. If inflation is high, the real value of that future amount may be lower than the nominal number suggests. A more complete simulator should help users distinguish nominal returns from real returns when the goal is long-term planning.
Rebalancing is also easy to underestimate. A portfolio that starts as 60% stocks and 40% bonds may drift to a very different allocation after a strong equity market. Without rebalancing, the portfolio may become riskier over time. With rebalancing, the result may be smoother but not always higher. For multi-asset simulations, rebalancing frequency can change both risk and return. This is one reason advanced tools like a premium portfolio simulator can be more useful than a simple single-asset calculator.
Withdrawals add another layer. A retirement investor drawing money from a portfolio is exposed to sequence-of-returns risk. A poor market early in retirement can harm the portfolio much more than the same poor market later. A simulator that models withdrawals should show not only final value, but also depletion risk, recovery periods, and the difference between withdrawing a fixed amount and withdrawing a percentage.
Assumptions that improve realism
- Dividends or distributions reinvested
- Management fees and transaction costs
- Inflation-adjusted spending or goals
- Rebalancing frequency
- Withdrawal timing and amount
Assumptions that can mislead
- Constant annual returns every year
- No fees, no taxes, no trading friction
- Perfect dividend reinvestment without delay
- Ignoring bad start dates
- Ignoring behavior during drawdowns
Backtests are useful, but they are not forecasts
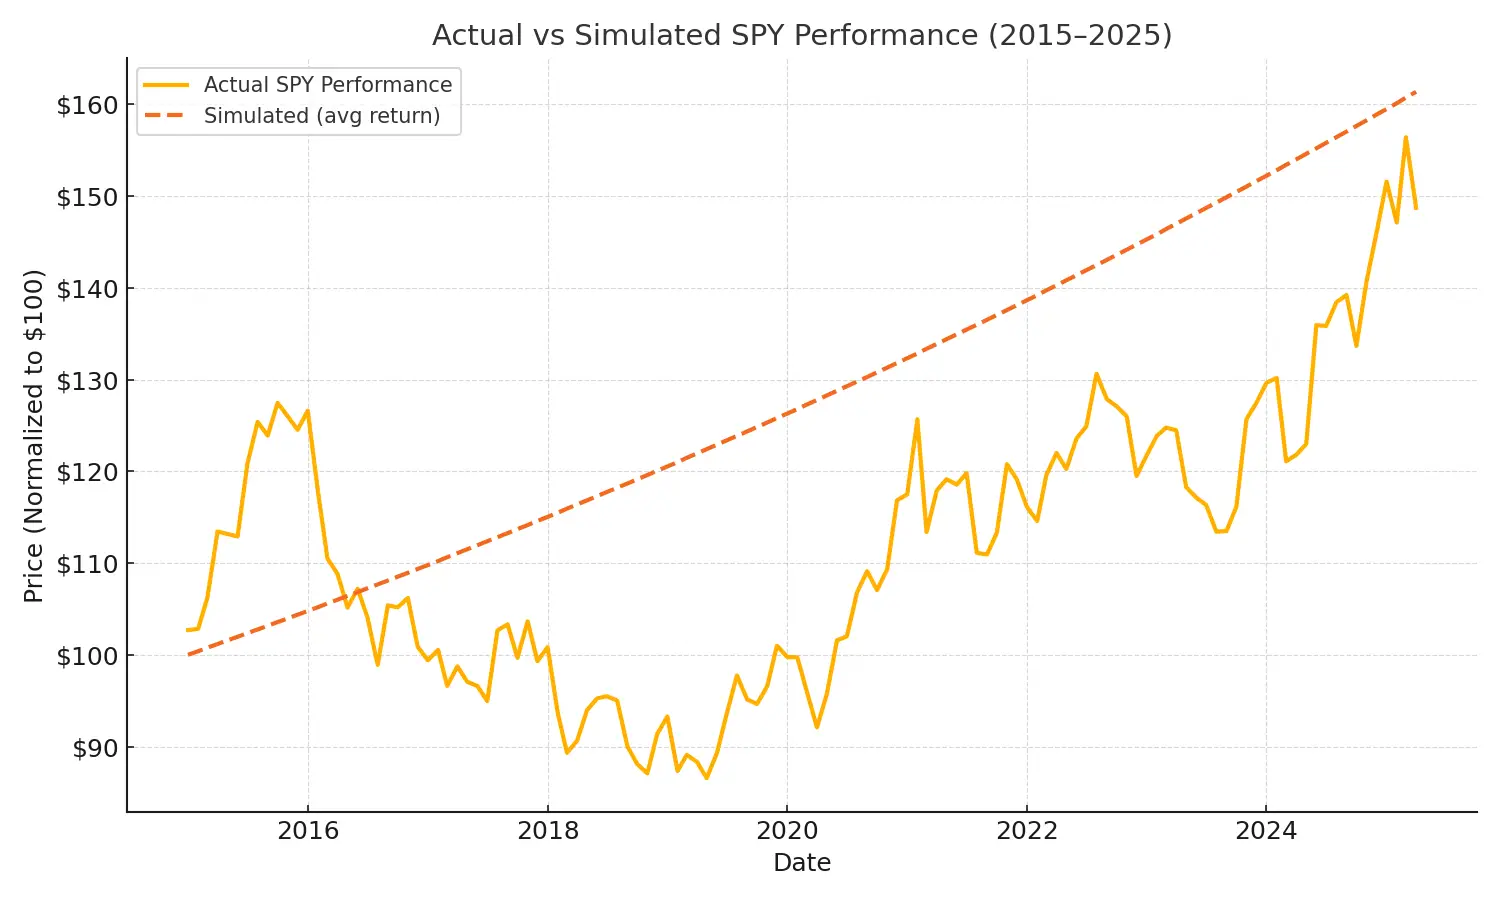
A backtest answers a historical question: “What would have happened if I had invested this way during this period?” It is a powerful learning tool because it shows actual market paths, not just theoretical averages. You can see drawdowns, recoveries, long flat periods, and the effect of contribution timing. That makes backtests more concrete than simple future-value formulas.
But a backtest is not a promise. The market regime that produced the result may not repeat. Interest rates, valuations, inflation, regulation, technology, liquidity, and investor behavior can all change. A backtest of Bitcoin, Apple, SPY, VOO, or QQQ can show historical performance, but it cannot guarantee that the next decade will behave like the last decade.
The best way to use backtests is to test robustness. If a strategy only looks good from one perfect start date, be careful. If it looks reasonable across many start dates, many contribution schedules, and many market conditions, it may be more robust. This is why comparing DCA, lump sum, bear markets, bull markets, and crash periods can be more useful than showing only the best case. When readers ask are investment simulators accurate, robustness across periods is one of the strongest answers.
For that reason, pages like Lump Sum vs DCA, SPY crash recovery, and DCA during the 2008 crash can help investors see multiple environments instead of one clean story.
How accurate are DCA simulations?
DCA simulations can be quite accurate historically if the contribution schedule, dates, prices, and fees are handled correctly. The simulator must decide what happens when a contribution date falls on a weekend or market holiday. It must decide whether to invest on the next available trading day or the previous one. Over a long period, these small choices usually do not dominate the result, but they still affect precision.
DCA simulations are especially useful because many real investors invest from monthly income. A lump sum backtest may be mathematically interesting, but not everyone has a large amount available on day one. A recurring investment model often matches real behavior better. If someone asks are investment simulators accurate for monthly investing, DCA timing rules are one of the first assumptions to inspect. It also shows whether a strategy is psychologically easier to follow because the investor is not making one huge entry decision.
However, DCA simulations can still mislead if users ignore opportunity cost. If markets rise steadily, DCA may lag lump sum because cash waits on the sidelines. If markets fall after the start date, DCA may look better because later contributions buy at lower prices. Neither method is universally superior. The right interpretation depends on risk tolerance, cash availability, and behavior.
The most accurate DCA simulation is usually the one that matches how you would actually invest. If you are paid monthly, a monthly contribution may be more realistic than weekly investing. If your brokerage charges fees per trade, fewer larger contributions may be more realistic than many tiny trades. If your goal is automation, the contribution date should match your real deposit schedule. Accuracy improves when the simulation reflects real behavior instead of an idealized plan.
For long-term investors, DCA accuracy should also include the difference between amount invested and amount held in cash. A person planning to invest $12,000 over a year may compare investing all $12,000 immediately with investing $1,000 per month. The DCA version has uninvested cash early in the period. That cash position is part of the strategy, not a minor detail. The simulator should make it clear whether uninvested cash earns nothing, earns interest, or is ignored.
How accurate are future investment projections?
Future projections are less accurate than historical backtests because they depend on assumptions about returns that have not happened yet. If the question is are investment simulators accurate for forecasting, the honest answer is that they are scenario tools, not prediction engines. A projection may use a fixed annual return, a range of possible returns, historical average returns, or a Monte Carlo model. Each approach has tradeoffs. A fixed return is easy to understand but too smooth. Historical averages are grounded in real data but may not repeat. Monte Carlo simulations show a range of possible outcomes but depend heavily on the inputs chosen.
A good projection should be treated as a planning scenario, not a prediction. If you assume an 8% annual return, the calculator is not saying you will earn exactly 8%. It is showing what happens if that assumption is true. The real market may deliver 20%, -15%, 5%, or no return in a given year. Sequence matters. Volatility matters. Contributions and withdrawals matter. That is why a range of outcomes is often more honest than one precise number.
For retirement planning, future projections should be especially cautious. Inflation, withdrawal timing, taxes, healthcare costs, market drawdowns, and longevity all interact. A simple compound interest calculator is useful for learning, but it should not replace a full financial plan. A stronger approach is to test optimistic, base, and conservative scenarios, then ask whether the plan still works when assumptions are less favorable.
Historical backtest
Best for asking what happened in a real past period. More concrete, but limited by the selected window.
Future projection
Best for planning under assumptions. Useful for goals, but less reliable as a forecast.
Common mistakes when using investment simulators
The first mistake is overfitting. This happens when someone adjusts dates, assets, weights, and rules until a historical result looks perfect. A strategy that looks amazing only after heavy hindsight tuning may not be reliable going forward. The more complex the rule, the more important it becomes to test whether the result survives different periods.
The second mistake is ignoring survivorship bias. If a simulator only includes assets that survived and performed well, the result can look stronger than reality. Investors need to remember that today’s popular assets are the survivors. Many funds, companies, and speculative assets disappear, merge, underperform, or become irrelevant.
The third mistake is ignoring the investor. A simulation may show that a volatile asset produced the best long-term return, but if the investor would have sold during a 60% drawdown, the simulated return is not realistic for that person. Behavioral accuracy matters. A good strategy is not only one that works on paper. It is one that the investor can actually follow.
The fourth mistake is using a simulator to justify a decision that has already been made emotionally. If someone already wants to buy an asset, they may search for the start date, benchmark, or chart that proves the idea. This turns a simulator into a confirmation machine. A better use is to challenge the idea: test bad periods, compare alternatives, include fees, and ask what would make the strategy fail.
The fifth mistake is ignoring benchmarks. A strategy might look good in isolation but weak compared with a simple index fund. If a custom portfolio requires more complexity, higher fees, more monitoring, or more emotional discipline, it should offer a clear reason for that extra effort. Comparing against SPY, VOO, VT, QQQ, or a balanced portfolio can reveal whether the strategy added value or simply rode the broader market. The SPY vs average investor comparison is a useful example of why benchmark discipline and investor behavior should be part of the accuracy check.
False precision
A precise output is only as good as the assumptions behind it.
Cherry-picked dates
One perfect start date can make almost any strategy look better than it really is.
Ignoring fees
Small recurring costs can become large over long horizons.
Ignoring behavior
A strategy that cannot be followed during stress is not practically accurate.
Investment simulator accuracy checklist
Before trusting a simulation, review the assumptions. You do not need to be a quant analyst. You just need to know what the model includes, what it excludes, and what question it is answering. A transparent simulator should make this easier, not harder. This checklist is the practical answer to are investment simulators accurate for your specific decision.
This checklist is also useful for comparing different portfolio simulators, DCA calculators, retirement calculators, and backtesting tools. A beautiful interface is helpful, but accuracy comes from the model underneath. Look for tools that explain data sources, show limitations, include friction, and let you change assumptions rather than forcing one hidden default.
| Question | Why it matters | Better practice |
|---|---|---|
| Is the data adjusted? | Splits and dividends affect long-term performance. | Use adjusted or total return data when possible. |
| Are fees included? | Fees compound against the investor. | Add management fees, trading fees, and spreads where relevant. |
| Are multiple periods tested? | One window can be misleading. | Compare bull markets, bear markets, and bad start dates. |
| Are drawdowns shown? | Final value hides pain along the path. | Review max drawdown and recovery periods. |
| Is the result nominal or real? | Inflation changes purchasing power. | Use real returns for long-term spending goals. |
A better workflow for using investment simulators
The best way to use a simulator is not to run one scenario and accept the result. A stronger workflow starts with a question, tests a base case, then pressures the assumptions. For example, instead of asking “Will this ETF make me rich?” ask “How did this ETF perform during different market environments, and how would monthly contributions have changed the experience?” That is a better question because it includes time, behavior, and risk.
Start by defining the decision. Are you comparing DCA versus lump sum? Testing Bitcoin versus Apple? Comparing SPY versus QQQ? Planning retirement withdrawals? Each question needs a different model. Then choose realistic inputs: amount invested, contribution frequency, time horizon, fees, rebalancing, and benchmark. After that, run the base case and write down what the result seems to imply.
Next, try to break the result. Move the start date. Add fees. Use a lower return assumption. Add inflation. Compare against a simple ETF. Review the worst drawdown. If the strategy still looks reasonable after these tests, it may be more robust. If it only works under one perfect set of assumptions, the simulator is warning you, not confirming you. That is the practical test behind are investment simulators accurate.
Novice-friendly workflow
Advanced workflow
Use simulators as a decision system, not a prediction machine
A good simulator helps you ask better questions. What happens if I invest monthly? What happens if I start during a crash? How much do fees reduce my outcome? How did a portfolio behave during past drawdowns? What if I compare a single stock, Bitcoin, an ETF, and a diversified portfolio?
The free tools are useful for quick education and simple scenarios. Premium tools become more valuable when the question includes weighted portfolios, multiple assets, rebalancing, fees, withdrawals, scenario saving, and exports. That is where a simulator stops being a curiosity and becomes a repeatable research workflow.
- Investment Simulator — test historical scenarios, DCA, lump sum, and drawdowns.
- DCA Calculator — model recurring contributions and portfolio growth.
- Premium DCA Calculator — compare weighted portfolios, fees, rebalancing, withdrawals, and export reports.
- Methodology — understand how WhatIfInvested approaches data, assumptions, and financial modeling.
- Backtesting workflow — learn how to test one strategy without confusing a backtest with a forecast.
- All calculators — choose the right tool for backtesting, DCA, compound growth, or budgeting.
Related guides
How to backtest your investment strategy
Learn how to evaluate a strategy using historical data and avoid common backtesting traps. Read the guide.
Lump Sum vs DCA
Compare two major investing methods and understand when each one can make sense. Read the guide.
Why most investors underperform
Simulator outputs are only useful if investors can follow the plan. Read the guide.
Long-term investing psychology
Understand why time, behavior, and discipline often matter more than perfect timing. Read the guide.
Frequently asked questions
Are investment simulators accurate?
Are investment simulators accurate? They can be accurate for historical backtests when data and assumptions are handled correctly. They are less accurate as future predictions because future returns, volatility, inflation, taxes, and investor behavior are uncertain.
What makes an investment simulator inaccurate?
Poor data, missing dividends, ignored fees, wrong currency assumptions, cherry-picked dates, missing drawdowns, and unrealistic return assumptions can all make simulator results misleading.
Are DCA calculators reliable?
DCA calculators are reliable when they correctly apply contribution dates, asset prices, fees, and reinvestment assumptions. They should be used to compare scenarios, not to guarantee future results.
Should I trust Monte Carlo simulations?
Monte Carlo simulations can help explore a range of possible outcomes, but they depend heavily on assumptions about returns, volatility, correlations, inflation, and withdrawals. They are useful for planning, not certainty.
Do simulators include taxes?
Some simulators include taxes and others do not. Tax rules vary by country, account type, asset type, holding period, and investor situation, so tax results should be treated carefully.
What is the best way to use an investment simulator?
Use it to compare scenarios, stress-test assumptions, review drawdowns, and understand tradeoffs. Do not use one simulation result as a guaranteed forecast.
What is the difference between a backtest and a projection?
A backtest uses real historical data to show what would have happened in the past. A projection estimates what might happen in the future based on assumptions such as return, volatility, inflation, fees, and contributions.
Why do different investment simulators show different results?
Different simulators may use different data sources, dividend assumptions, fee settings, currencies, contribution timing rules, tax assumptions, or rebalancing methods. Small model differences can create different long-term outputs.
Can a simulator help avoid bad investment decisions?
It can help by making risks visible before money is invested. A simulator can reveal drawdowns, weak start dates, fee drag, overconcentration, and unrealistic expectations, but it cannot remove investment risk.
Final verdict
Are investment simulators accurate enough to use? Yes, when they are transparent, realistic, and interpreted correctly. They can help investors compare DCA versus lump sum, understand drawdowns, estimate long-term compounding, and make better decisions before committing capital. Their weakness is not that they are useless. Their weakness is that users sometimes ask them to predict the future with certainty.
The best approach is to use simulation as one part of a broader decision process. Test multiple periods, include fees, review drawdowns, compare strategies, and ask whether you could actually follow the plan. Then use tools like the Investment Simulator, DCA Calculator, and Premium DCA Calculator to turn assumptions into a clearer investing framework.