SPY vs VOO: 7 Crucial Differences Before You Invest
SPY vs VOO is not really a question of which fund owns better stocks. Both track the S&P 500. The real decision is whether you value SPY's trading depth, VOO's lower ongoing cost, or the simplest long-term ETF workflow.
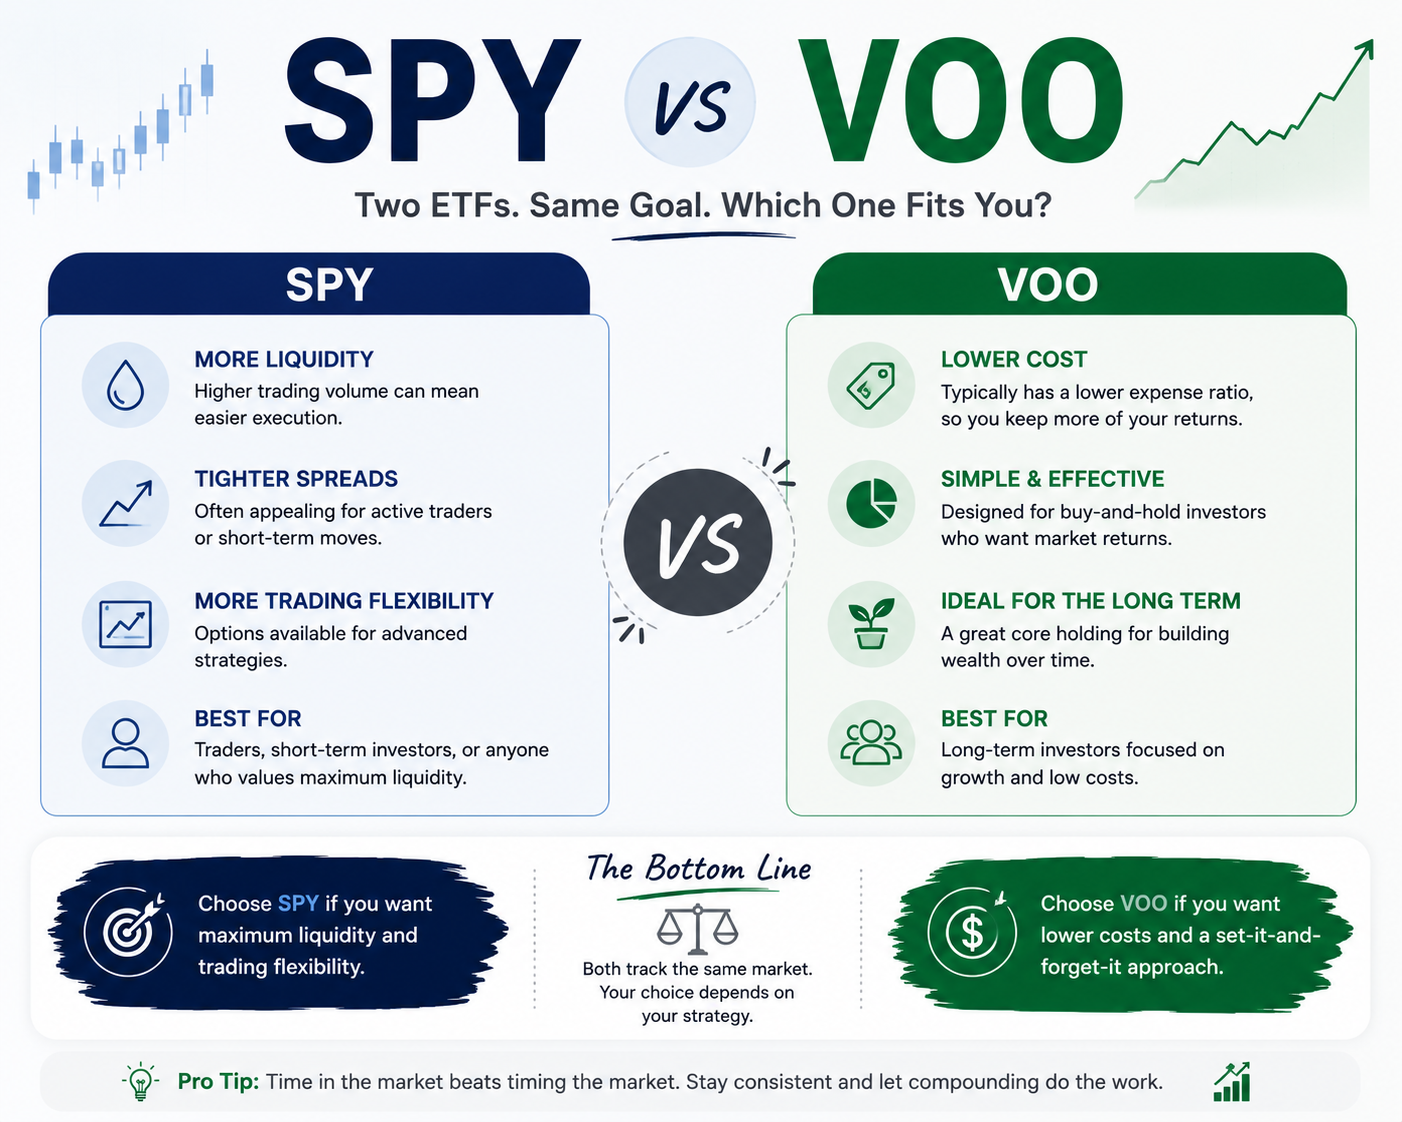
VOO is usually the better fit for buy-and-hold investors because the expense ratio is lower.
SPY is usually stronger for active trading, large orders and options strategies because liquidity is deeper.
Performance should be very close because both funds track the same index before costs.
Decision: VOO Usually Wins for Long-Term Investors
For most long-term investors, VOO is the simpler answer in the SPY vs VOO debate. It tracks the same S&P 500 benchmark as SPY and usually charges a lower ongoing fee. If you are buying an ETF, reinvesting dividends, adding money monthly and holding for decades, that lower cost is the clearest advantage.
SPY is not a weak fund. It is one of the most important ETFs ever created and remains extremely liquid. The reason SPY stays popular is not that it is structurally better for every investor. It is because traders, institutions and options users often need deep markets, tight execution and massive options volume. For those use cases, SPY can be the practical choice even though its expense ratio is higher.
SPY vs VOO: Side-by-Side Comparison
The most useful way to compare SPY vs VOO is not to ask which one has better holdings. Both are designed to follow the S&P 500. Instead, compare them by investor job: long-term compounding, trading, options, account placement and operational simplicity.
| Category | SPY | VOO | Better fit |
|---|---|---|---|
| Benchmark | S&P 500 Index | S&P 500 Index | Tie |
| Issuer | State Street SPDR | Vanguard | Tie |
| Launch history | Older, launched in 1993 | Newer, launched in 2010 | SPY for history |
| Expense ratio | Higher than VOO | Lower than SPY | VOO |
| Daily trading liquidity | Very deep | Strong, but usually less than SPY | SPY |
| Options market | Very deep options ecosystem | Options available, but less central | SPY |
| Buy-and-hold simplicity | Excellent | Excellent with lower fee drag | VOO |
| Expected long-term performance | Very close to S&P 500 minus costs | Very close to S&P 500 minus costs | VOO by cost edge |
Official fund pages should be used as the source of truth because fees, assets, holdings and distributions can change. This article links to the official State Street and Vanguard pages near the end.
What Is SPY?
SPY is the SPDR S&P 500 ETF Trust from State Street. It is one of the oldest and most heavily traded ETFs in the world. In a SPY vs VOO comparison, SPY's main strength is not that it owns a different version of the S&P 500. Its strength is market structure: liquidity, trading depth, institutional familiarity and a large options market.
That matters for certain investors. A trader who enters and exits positions quickly may care more about execution than a few basis points of annual expense ratio. An options trader may prefer SPY because the options chain is often deeper and more actively used. A large institution may choose SPY because it can absorb large flows with minimal friction.
For the everyday long-term investor, however, SPY's strengths may be less important. If your plan is to buy $200, $500 or $1,000 each month and hold for decades, you probably do not need the deepest possible options market. You need low cost, reliable tracking, easy reinvestment and the discipline to stay invested.
SPY is strongest when
- You trade frequently.
- You use options strategies.
- You manage large intraday orders.
- You value the longest ETF history.
SPY is less compelling when
- You are a passive buy-and-hold investor.
- You do not use options.
- Your order size is modest.
- You want the lowest possible long-term fee drag.
What Is VOO?
VOO is the Vanguard S&P 500 ETF. It also tracks the S&P 500, giving exposure to many of the largest publicly traded U.S. companies. In the SPY vs VOO debate, VOO's strongest argument is straightforward: it gives very similar index exposure at a lower expense ratio.
That fee gap is small in any single year, but passive investing is a long game. A lower expense ratio does not guarantee a better return in every short window, but when two funds track the same index, lower cost is one of the few advantages an investor can control. Over 20 or 30 years, avoiding unnecessary fee drag is a clean decision.
VOO is also liquid enough for most individual investors. The fact that SPY trades more does not mean VOO is illiquid. For normal buy-and-hold orders, VOO usually has more than enough market depth. The investor still needs to use reasonable order practices, such as avoiding market orders in fast conditions and being aware of bid-ask spreads, but VOO is not a niche product.
VOO is strongest when
- You want a long-term S&P 500 core.
- You prefer low ongoing costs.
- You invest monthly or quarterly.
- You do not need SPY's options depth.
VOO is less compelling when
- You actively trade the ETF intraday.
- You use options as a core strategy.
- You need the deepest possible trading book.
- Your broker or strategy specifically requires SPY.
Fees: Why VOO Has the Long-Term Edge
The fee comparison is the cleanest part of SPY vs VOO. SPY's expense ratio is higher than VOO's, while both funds aim to track the same benchmark. If the holdings are broadly the same and the index is the same, a lower cost fund has a built-in advantage for long-term holders.
Small ETF fees can feel invisible because they are not usually charged as a bill that arrives in the mail. They are reflected inside fund performance. That is why investors sometimes underestimate them. A difference of a few basis points does not decide whether you build wealth. Your savings rate, time horizon, asset allocation and behavior matter much more. But when choosing between two nearly identical S&P 500 exposures, the fee gap is still worth respecting.
| Portfolio size | Why the fee gap matters | Decision implication |
|---|---|---|
| $10,000 | The dollar difference is small, but the habit of choosing low cost is useful. | VOO is cleaner for buy-and-hold. |
| $100,000 | The annual cost difference becomes more visible. | VOO's advantage becomes easier to justify. |
| $500,000+ | Small percentage gaps can become meaningful in dollars over time. | VOO usually makes more sense unless SPY's liquidity is needed. |
Liquidity and Options: Why SPY Still Matters
Liquidity is the strongest argument for SPY. SPY is often one of the most actively traded ETFs in the market. That can matter for institutions, tactical traders and options users. In those contexts, the difference between SPY and VOO is not just expense ratio. It is market access.
For example, a trader using short-dated options may prefer SPY because its options market is typically deeper. A portfolio manager who needs to move large exposure quickly may also prefer SPY because the trading ecosystem is extremely mature. SPY has become a benchmark trading instrument, not just a long-term holding.
For a normal long-term investor, this advantage is real but often unnecessary. A person buying shares once per month does not need the same liquidity profile as an institution. VOO's liquidity is generally sufficient for ordinary portfolio building. The practical question is whether you are investing or trading. The answer usually decides the fund.
Performance: SPY and VOO Should Stay Very Close
Because both ETFs track the S&P 500, SPY vs VOO performance should be very similar before fees. The S&P 500 itself is the main driver. If large U.S. companies perform well, both funds should benefit. If the S&P 500 falls sharply, both funds should decline. The ETF wrapper does not eliminate market risk.
When investors see small performance differences between SPY and VOO, those differences usually come from expenses, dividend handling, tracking details, timing and market price versus net asset value. They are not usually caused by one fund "picking better stocks." The underlying benchmark is the same.
This is why the decision should not be based on a one-year return chart. A one-year chart can show tiny differences that look dramatic when zoomed in. For a long-term investor, the more durable questions are: Which fund is cheaper? Which fund is easier to hold? Which fund fits the account? Which fund will I keep through market drawdowns?
| Performance question | Best answer |
|---|---|
| Will SPY and VOO move similarly? | Yes, because both target the S&P 500. |
| Does VOO usually have a cost advantage? | Yes, for buy-and-hold investors focused on expense ratio. |
| Can SPY be better for short-term trading? | Yes, when liquidity and options access matter. |
| Should I switch just because of a tiny short-term return gap? | Usually no. Consider taxes, spreads and whether the change is meaningful. |
Dividends and Reinvestment
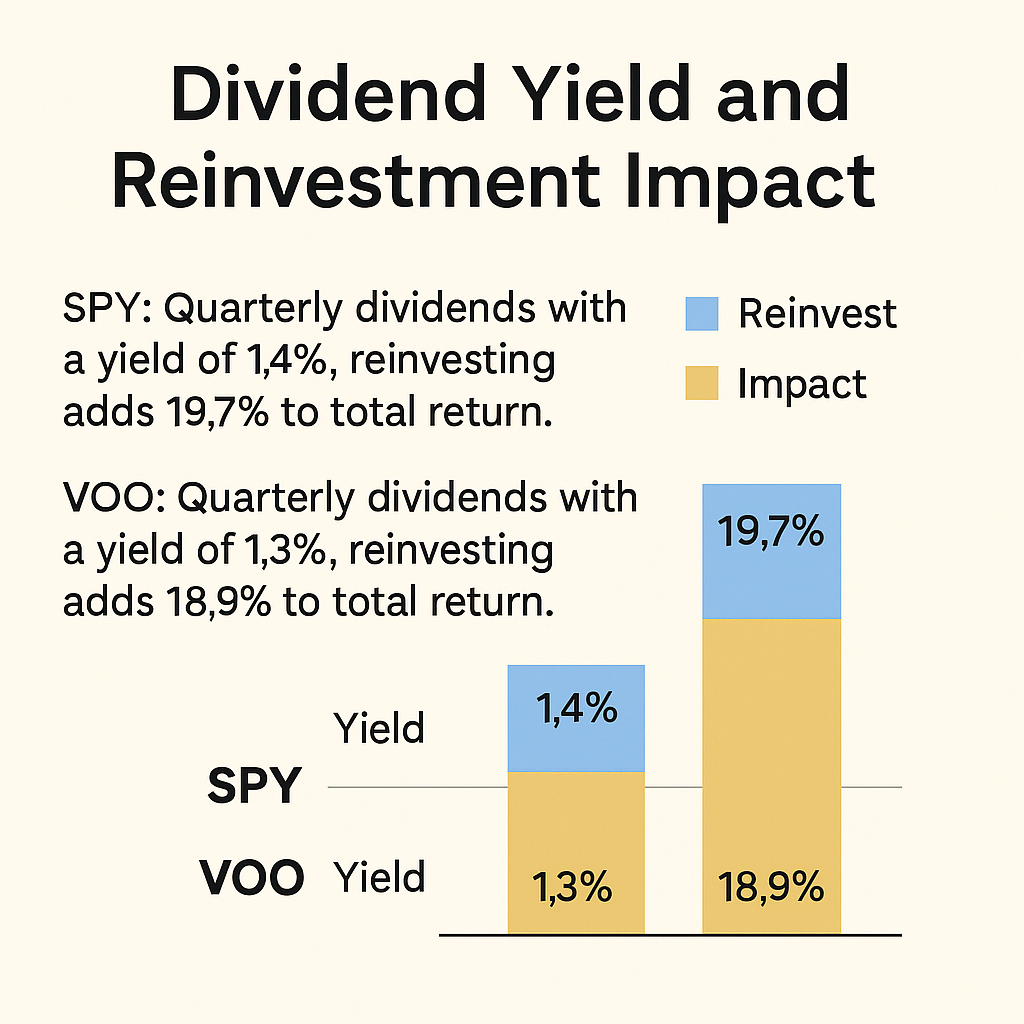
SPY and VOO both distribute dividends from the underlying S&P 500 companies. Dividend yield changes over time with market prices, company payouts and index composition. For long-term investors, the key is not simply which ETF shows a slightly higher yield at one moment. The key is whether dividends are reinvested consistently and whether taxes are managed appropriately.
A reinvested dividend buys more shares. Over decades, those shares can create additional dividends of their own. That is why total return matters more than price return. Investors comparing SPY vs VOO should avoid looking only at the chart price. They should compare total return, including reinvested distributions.
In taxable accounts, dividends may create annual tax drag. In tax-advantaged accounts, reinvestment can be cleaner. The correct decision depends on account type, country of residence and the investor's broader portfolio.
Tax Considerations for U.S. Investors
For U.S. investors, SPY and VOO can both be tax-efficient ETF choices compared with many actively managed funds. ETFs often use in-kind creation and redemption mechanics that can reduce capital gains distributions. Still, that does not make the funds tax-free. Dividends may still be taxable in a regular brokerage account, and selling at a gain can create capital gains tax.
If you hold SPY or VOO in a tax-advantaged account such as an IRA or 401(k), the decision may be simpler because annual taxable distributions are not treated the same way as in a taxable brokerage account. In a taxable account, switching from SPY to VOO can trigger a realized gain if SPY has appreciated. That tax cost can outweigh the fee savings, especially for a large position with embedded gains.
SPY vs VOO for Canadian Investors
For Canadians, SPY vs VOO is only part of the decision. You also need to think about currency conversion, U.S. dividend withholding tax, account type and whether a Canadian-listed ETF would be simpler. A Canadian investor can buy U.S.-listed ETFs, but the result may depend on whether the holding is in an RRSP, TFSA or non-registered account.
In many cases, Canadian investors comparing SPY and VOO should also compare Canadian alternatives such as VFV or broader Canadian-listed portfolio ETFs. If the investor wants S&P 500 exposure in Canadian dollars, a Canadian-listed fund may reduce operational friction. If the investor has a larger RRSP and is comfortable holding U.S. dollars, U.S.-listed ETFs may become more attractive.
The best answer is not universal. A small account may value simplicity. A large account may value tax and currency optimization. A hands-off investor may prefer Canadian-listed funds. A more advanced investor may use U.S.-listed ETFs inside specific accounts. For a deeper Canada-specific version, see VFV vs VOO for Canadians.
Decision Matrix: Which ETF Should You Choose?
Use this decision matrix to make the SPY vs VOO choice practical. The goal is not to prove that one ETF is always superior. The goal is to match the fund to the job.
| Your situation | Likely better fit | Why |
|---|---|---|
| You invest monthly and hold for decades. | VOO | Lower fee drag matters more than maximum trading depth. |
| You trade intraday or use short-term options. | SPY | Liquidity and options depth may matter more than expense ratio. |
| You already own SPY in a taxable account with a large gain. | Possibly keep SPY | Tax cost of switching may exceed fee savings. |
| You are building a simple retirement portfolio from scratch. | VOO | Low cost and simple S&P 500 exposure are aligned with buy-and-hold investing. |
| You are a Canadian investor. | Depends | Compare VOO, SPY and Canadian-listed alternatives by account type and currency needs. |
| You want all U.S. market exposure, not just S&P 500. | Neither may be ideal | Consider total-market ETFs such as VTI instead of S&P 500-only exposure. |
How SPY or VOO Fits Into a Portfolio
An S&P 500 ETF can be a strong core holding, but it is not a complete portfolio by itself for every investor. The S&P 500 is U.S. large-cap exposure. It does not include smaller U.S. companies in the same way a total-market ETF does, and it does not provide international stocks, bonds or cash reserves.
That does not make SPY or VOO bad. It simply means you should know what job the ETF is doing. If the job is "give me low-cost exposure to many of the largest U.S. companies," both funds can do it. If the job is "give me a globally diversified portfolio with bonds," you need more than SPY or VOO.
For many investors, the next step after choosing an S&P 500 ETF is deciding what sits around it: international equities, bonds, cash, or a small satellite tilt. Use the Investment Simulator to compare historical drawdowns and the DCA Calculator to model recurring contributions into ETF strategies.
Common SPY vs VOO Mistakes
- Overstating the difference: SPY and VOO are both excellent S&P 500 ETFs. The decision matters, but behavior and savings rate matter more.
- Ignoring taxes when switching: moving from SPY to VOO in a taxable account can create capital gains.
- Using SPY's liquidity as a reason when you do not trade: extra liquidity is useful only if your strategy needs it.
- Confusing S&P 500 exposure with total diversification: both funds are U.S. large-cap oriented.
- Choosing based on recent performance only: short-term return differences can be noise.
- Forgetting dividend reinvestment: total return matters more than price return.
FAQ: SPY vs VOO
Is VOO better than SPY for long-term investors?
VOO is usually better for long-term investors because it offers the same S&P 500 exposure with a lower expense ratio. SPY can still be better for traders and options users.
Do SPY and VOO hold the same stocks?
They both track the S&P 500, so their holdings should be very similar. Small differences can occur because of fund operations, timing, cash, expenses and index replication details.
Why do traders prefer SPY?
Traders often prefer SPY because it has extremely deep liquidity and a very active options market. That can matter for fast execution, large orders and short-term strategies.
Should I switch from SPY to VOO?
Not automatically. If SPY is held in a taxable account with unrealized gains, selling may create tax costs. Compare tax impact, future fee savings and your actual need for SPY's liquidity.
Is SPY or VOO better for monthly investing?
VOO is usually better for monthly investing because the lower ongoing fee fits a buy-and-hold contribution strategy. SPY's trading advantages are less important for simple monthly investing.
Are SPY and VOO enough for a full portfolio?
Not always. They provide U.S. large-cap exposure. Many investors also consider international stocks, bonds, cash reserves or total-market ETFs depending on their goals and risk tolerance.
Which ETF is better for Canadian investors?
It depends on account type, currency conversion and tax treatment. Canadians should compare SPY, VOO and Canadian-listed alternatives such as VFV before deciding.
Where can I test SPY vs VOO scenarios?
You can use the WhatIfInvested Investment Simulator to compare historical performance and the DCA Calculator to model recurring contributions into ETF strategies.
Official ETF Sources
ETF facts can change. Use official issuer pages as the source of truth before making an investment decision.
Educational content only. This article is not investment, tax or financial advice. Verify current fund documents, tax rules, account treatment and suitability before making investment decisions.