How Much Better Is SPY Than the Average Investor?
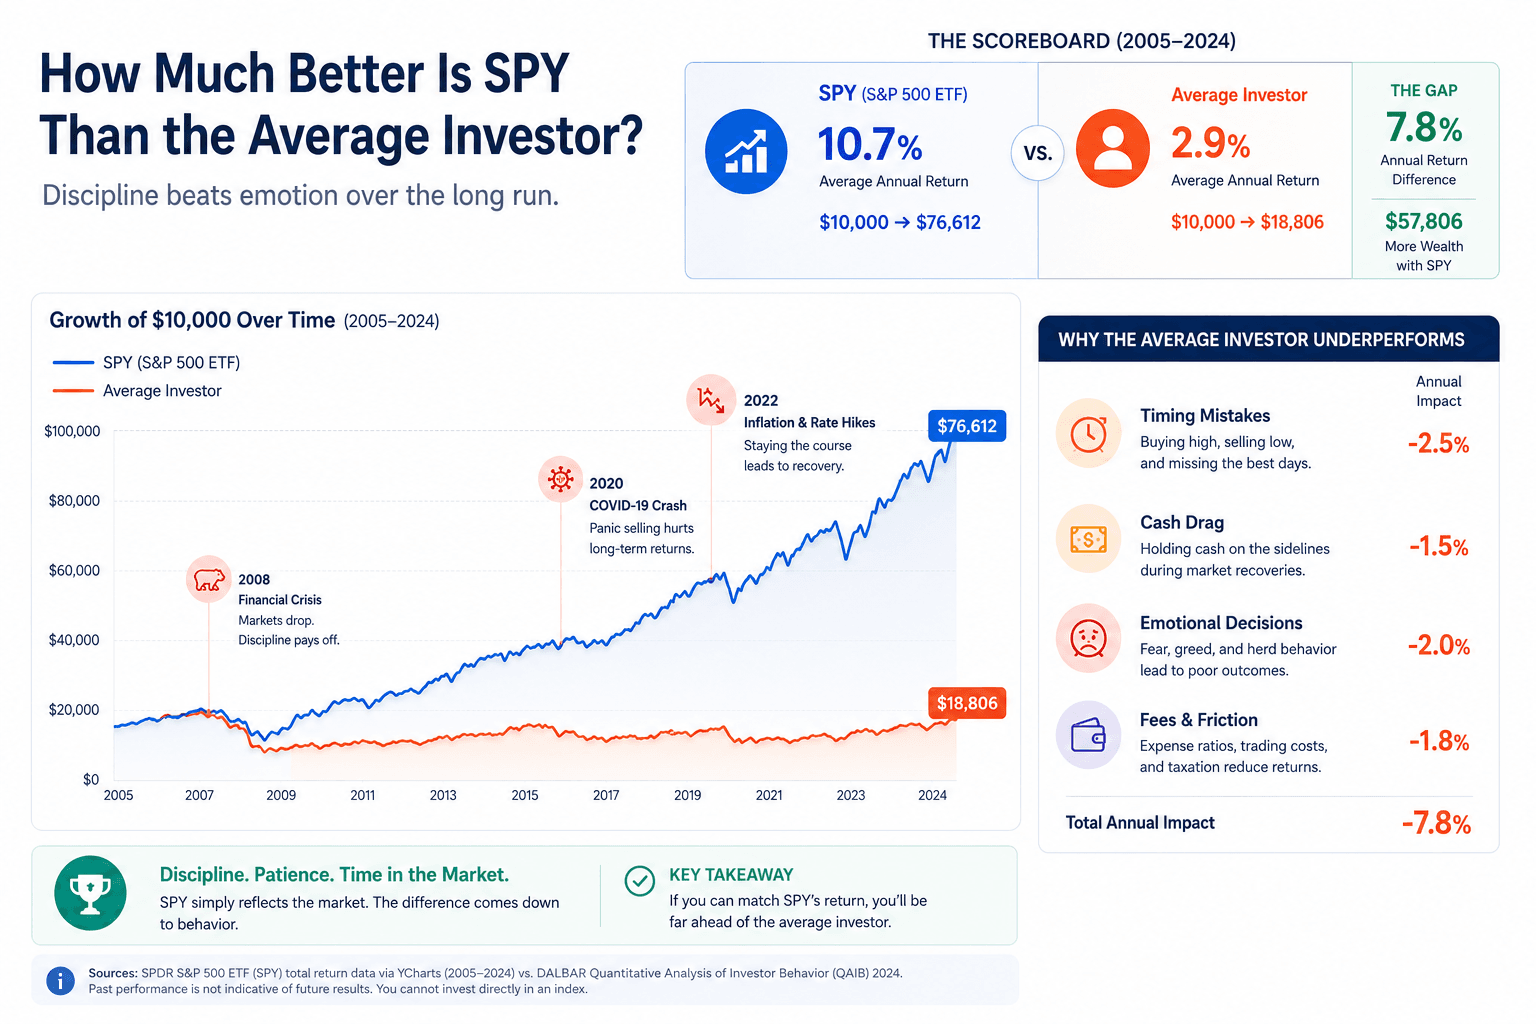
SPY is not magic. It is a low-cost S&P 500 ETF with a simple rule: stay invested in a broad market benchmark. The average investor often earns less because the real enemy is not access to SPY. It is timing mistakes, cash drag, panic selling, overtrading, fees, and inconsistent behavior. The real question is how much better is SPY than the average investor when behavior is included.
Quick Answer: How Much Better Is SPY Than the Average Investor?
SPY can be much better than the average investor because it removes many decisions that create underperformance. A person who buys and holds SPY gets broad S&P 500 exposure, low fees, high liquidity, dividend reinvestment potential, and participation in long-term U.S. equity growth. The average investor, however, may capture less than the market because their actual return is shaped by when they buy, when they sell, how much cash they keep idle, and how often they change strategy.
The important idea is not that SPY beats every investor. Some investors outperform SPY. The important idea is that SPY sets a difficult benchmark because it is simple, rules-based, diversified, and low-friction. Many people lose the comparison not because they picked terrible assets, but because they interrupt their own compounding.
That is why this article treats SPY than the average investor as a practical benchmark question. It is less about declaring one ETF superior to every portfolio and more about understanding why a simple strategy can beat complicated human behavior. In plain language, how much better is SPY than the average investor depends on how often the investor interrupts the plan.
SPY strength
It keeps investors exposed to a broad basket of large U.S. companies at low cost.
Investor weakness
The average investor often changes behavior at exactly the wrong time.
Real lesson
The edge is not just owning SPY. It is holding a market strategy long enough for it to work.
SPY vs the Average Investor: What Are We Really Comparing?
Comparing SPY with the average investor is not only a comparison of returns. It is a comparison of systems. SPY follows a benchmark. It does not panic, chase, overthink, wait for perfect clarity, or move to cash because a headline sounds frightening. The average investor has bills, emotions, market opinions, social media, news cycles, tax concerns, and the constant temptation to intervene.
This is why the “SPY vs average investor” question is useful. It separates asset performance from investor behavior. SPY shows what a broad market vehicle can deliver if held. The average investor result shows what happens after real human decisions enter the picture.
For official fund context, the SPDR SPY fund page explains the ETF’s benchmark objective, expense ratio, holdings, and fund characteristics. That official data should be the starting point when comparing SPY with any investor outcome. It also helps keep the “how much better is SPY than the average investor” question anchored to a real fund, not a vague market idea.
| Factor | SPY | Average investor | Why it matters |
|---|---|---|---|
| Decision process | Rules-based S&P 500 exposure | Often emotional and discretionary | Rules reduce timing mistakes. |
| Costs | Low ETF expense ratio | May include higher fees, trading costs, advisory costs, and tax drag | Small cost gaps compound for decades. |
| Diversification | Hundreds of large U.S. companies | Often concentrated in favorites, trends, or recent winners | Concentration increases regret and risk. |
| Behavior | No panic or greed | May buy high, sell low, pause, or overreact | Behavior can dominate asset selection. |
Why SPY Often Beats the Average Investor
SPY often beats the average investor because it benefits from structural advantages that sound boring but matter enormously. It is diversified. It is liquid. It is transparent. It is inexpensive compared with many active products. Most importantly, it gives investors a simple way to stay in the market.
That simplicity is powerful. A complicated strategy asks the investor to keep making judgment calls. Should they rotate sectors? Should they sell before a recession? Should they buy the dip now or wait? Should they move from growth to value? Should they hold cash because valuations look high? Each extra decision creates another chance to be wrong.
Broad participation
SPY owns exposure to the S&P 500 rather than relying on one company, one sector, or one prediction.
Low friction
Low costs and high liquidity mean less drag between market return and investor return.
Simple benchmark
It is easy to understand: own the broad U.S. large-cap market and let time do the heavy lifting.
Behavioral simplicity
A simple strategy is easier to hold than a complicated strategy that constantly demands new decisions.
This does not mean SPY is always the best possible investment. It can suffer large drawdowns. It is concentrated in U.S. large-cap equities. It can underperform other assets for long periods. But it remains a powerful benchmark because many investors fail to beat even a simple, low-cost market exposure after behavior and costs are included. That is the core reason people ask how much better is SPY than the average investor over long periods.
Why the Average Investor Falls Behind SPY
The average investor often falls behind SPY for the same reasons discussed in our guide on why most investors underperform the market: timing mistakes, performance chasing, fear, fees, cash drag, and lack of discipline. The difference is that SPY gives us a clean benchmark. It shows what could happen if an investor simply captured broad market returns without constantly interfering.
The behavior gap is not only about panic. Sometimes it is created by reasonable-sounding actions. An investor may hold too much cash because valuations feel high. They may pause contributions after a bad month. They may sell a boring ETF to buy a more exciting stock. They may switch funds after reading a convincing forecast. None of these decisions feels reckless in the moment, but they can accumulate into a major long-term gap. If you want to know how much better is SPY than the average investor, start by measuring those small interruptions.
Panic selling
Investors sell during drawdowns and then struggle to re-enter before the recovery.
Performance chasing
Investors move into assets after they have already had strong runs.
Cash drag
Money waits for a “better entry,” but the market can rise while the investor waits.
Overtrading
Frequent changes create taxes, spreads, fees, and emotional fatigue.
Concentration
A few favorite stocks can dominate the outcome and increase regret.
No written plan
Without rules, every market move becomes a new decision.
How to Measure the SPY vs Average Investor Gap
To answer “how much better is SPY than the average investor?” properly, you need to measure the right things. A simple price chart is not enough. The comparison should include the dates money was invested, whether dividends were reinvested, whether contributions were consistent, whether cash sat unused, and whether the investor changed course during drawdowns.
A fair comparison starts with the investor’s actual cash flows. If someone invested $500 every month, paused for eight months during a bear market, then added a large lump sum near a market high, their personal return can differ sharply from a clean SPY chart. That difference is the investor return gap. It is the difference between what the asset delivered and what the investor captured.
Asset return
This is what SPY delivered over a period. It answers: “What happened to the ETF?”
Investor return
This is what the investor earned after deposits, withdrawals, timing, taxes, costs, and behavior. It answers: “What happened to the person?”
| Measurement | What it shows | Why it changes the answer |
|---|---|---|
| Time-weighted return | Investment performance independent of cash flows | Useful for comparing funds, less useful for personal behavior |
| Money-weighted return | Return based on when money actually entered or left | Shows the investor’s real experience |
| Total gain | Dollars earned above contributions | Important for practical wealth building |
| Maximum drawdown | Largest peak-to-trough decline | Shows whether the investor could realistically hold |
| Cash drag | Return lost by keeping money uninvested | Often explains why cautious investors lag SPY |
Practical rule: do not compare yourself with a chart you never actually owned. Compare SPY with your real contribution pattern, your real pauses, your real withdrawals, and your real behavior during stress. That is the fairest way to answer how much better is SPY than the average investor in your own case.
A Simple Example: Same Market, Different Behavior
Imagine two investors with the same starting point. Investor A buys SPY monthly and does nothing dramatic. Investor B starts with the same intention but stops contributions after a market drop, waits for confirmation, then returns only after prices have already recovered. They both “like SPY,” but they do not earn the same result.
The gap comes from behavior. Investor A captures the boring middle of compounding. Investor B may avoid some uncomfortable moments, but also misses important recovery months. In many market cycles, the early rebound happens before the news feels safe. That is one reason a simple SPY strategy can look much better than the average investor’s real-world result.
Consistent investor
Invests on schedule, reinvests, and reviews the plan once or twice a year.
Reactive investor
Stops during fear, waits during recovery, and adds after confidence returns.
Behavior difference
The same ETF can produce different personal outcomes because the timing of actions differs.
This is also why investor education should not focus only on finding “the best ETF.” A great ETF held badly can produce mediocre results. A simple ETF held with discipline can quietly outperform a more complicated strategy that is constantly interrupted. The answer to how much better is SPY than the average investor often comes from this difference between asset return and investor behavior.
The Hidden Costs That Make SPY Look Even Better
SPY is often compared with stock picking, sector rotation, active funds, newsletters, option strategies, and tactical allocation. Some of those approaches can work. But each one must overcome extra friction. The more friction a strategy creates, the more it must outperform before the investor actually benefits.
Costs do not need to be dramatic to matter. A higher expense ratio, a few unnecessary trades, bid-ask spreads, taxable turnover, missed dividend reinvestment, or a year sitting in cash can quietly reduce long-term results. The average investor may not notice the drag in one month, but compounding notices everything.
Fund fees
Higher expense ratios reduce the amount left to compound.
Trading costs
Spreads and commissions matter when strategies change often.
Tax drag
Taxable gains can reduce after-tax compounding for active traders.
Advice drag
Advice can be valuable, but fees must be justified by better planning or behavior.
A low-cost SPY approach does not eliminate risk, but it keeps the hurdle low. The investor does not need to overcome a high fee structure before earning a market-like result. That low-friction design is a major reason SPY can compare favorably against the average investor. It is another reason the answer to how much better is SPY than the average investor can widen as decades pass.
Can an Investor Beat SPY?
Yes, an investor can beat SPY. The question is whether they can do it consistently, after costs, after taxes, after mistakes, and without taking risks they do not understand. Beating SPY for one year is not the same as building a repeatable process. A concentrated portfolio can outperform for a period, but it can also underperform brutally if the thesis breaks.
Investors who beat SPY usually have one of three advantages. They may have a real analytical edge, a behavioral edge, or a planning edge. Analytical edge means they understand businesses, valuation, risk, and portfolio construction better than most people. Behavioral edge means they can hold through periods when the strategy looks wrong. Planning edge means they match the investment strategy to cash needs, taxes, and time horizon so they are not forced to sell at a bad moment.
Analytical edge
You understand the asset deeply enough to make better decisions than the market average.
Behavioral edge
You can stay with a strategy through pain, boredom, and underperformance.
Planning edge
Your cash reserve, time horizon, and tax setup help you avoid forced mistakes.
The danger is confusing confidence with edge. Many investors believe they can beat SPY because they have strong opinions. Strong opinions are not the same as a repeatable investment process. If the process cannot be written down, tested, reviewed, and followed under stress, it may not be an edge. It may just be a story. Before trying to beat SPY, it is worth asking how much better is SPY than the average investor who trades without a written process.
When SPY May Not Be Enough
Although SPY is a powerful benchmark, it is not automatically a complete financial plan. It tracks U.S. large-cap stocks. That means it can be appropriate for growth-oriented investors with long horizons, but it may be too volatile for someone who needs money soon. It also does not include bonds, cash, international stocks, or specific tax planning.
This is where the average investor can improve without trying to “beat” SPY directly. Sometimes the better goal is not maximum return. Sometimes the better goal is a portfolio that a person can actually hold. A globally diversified portfolio, a balanced allocation, or a written DCA plan may underperform SPY during certain bull markets but still produce a better life outcome if it helps the investor stay disciplined.
| Situation | SPY concern | Possible adjustment |
|---|---|---|
| Short time horizon | Large equity drawdown can arrive at the wrong time | Hold adequate cash or bonds for near-term needs |
| High stress during volatility | Investor may sell during declines | Use a more balanced allocation |
| Non-U.S. investor | Currency, withholding tax, and account type matter | Compare local ETF options and tax accounts |
| Retirement withdrawals | Sequence risk can damage outcomes | Plan withdrawal rules and cash buffers |
Can DCA Help the Average Investor Keep Up With SPY?
Dollar-cost averaging can help because it changes the question from “Is now the perfect time?” to “Am I following my schedule?” That shift matters. Many investors lag SPY not because they lack market exposure, but because they enter and exit based on emotion. A recurring investment plan reduces the number of timing decisions.
DCA does not guarantee higher returns than a lump sum investment. If markets rise steadily, investing immediately can often win mathematically. But DCA can help behaviorally because it makes participation easier. For many investors, the best strategy is the one they can actually keep through volatility. This is why the question of how much better is SPY than the average investor is partly a question about contribution discipline.
DCA advantage
Reduces entry anxiety and keeps money moving into the market.
DCA limitation
Can lag lump sum when markets rise quickly.
Best use
Use it when consistency matters more than perfect timing.
You can test recurring investment scenarios with the DCA Calculator, compare historical periods with the Investment Simulator, and evaluate more advanced assumptions with Premium DCA.
How to Behave More Like a Long-Term SPY Investor
If the average investor loses ground because of behavior, the solution is to build rules that make better behavior easier. The goal is not to worship SPY. The goal is to understand why a simple benchmark can beat complicated human decision-making.
A better investor process is simple enough to follow, specific enough to reduce confusion, and flexible enough to survive real life. The process should explain what each account is for, when money gets invested, how often the portfolio is reviewed, what happens during a crash, and which changes are allowed.
| Process layer | Practical question | Better behavior |
|---|---|---|
| Goal | What is this money for? | Match risk to time horizon |
| Contribution rule | When do I invest? | Automate instead of waiting for confidence |
| Allocation rule | What do I own and why? | Use a core allocation that is easy to hold |
| Crash rule | What will I do during a 30% decline? | Precommit before fear arrives |
| Review rule | When do I evaluate the plan? | Review on schedule, not on emotion |
Use WhatIfInvested to Test the Gap Yourself
The best way to understand the SPY vs average investor gap is to test scenarios. What if you invested monthly? What if you paused during a crash? What if you held through the worst drawdowns? What if you compared DCA with lump sum? Tools cannot predict the future, but they can make behavior visible. They also make the question “how much better is SPY than the average investor?” concrete instead of abstract.
DCA Calculator
Model recurring investment behavior and contribution discipline.
SPY Is a Benchmark. Your Behavior Is the Real Test.
A simple ETF can outperform the average investor because it does not panic, chase, overtrade, or wait for certainty. If you want better results, start by improving the process you can control.
Frequently Asked Questions
How much better is SPY than the average investor?
SPY can be much better than the average investor because it is low-cost, diversified, and rules-based. The exact gap depends on the period and investor behavior, but many investors lag broad market returns because of timing mistakes, fees, cash drag, and emotional decisions.
Does SPY always beat individual investors?
No. Some investors outperform SPY. But SPY is a difficult benchmark because it captures broad U.S. large-cap exposure at low cost without emotional trading.
Why do average investors lag SPY?
Average investors often lag SPY because they buy after strong performance, sell during downturns, overtrade, pay higher costs, hold too much cash, or concentrate in losing positions.
Can DCA into SPY improve results?
DCA into SPY can help investors stay consistent and reduce timing anxiety. It does not guarantee higher returns than lump sum investing, but it can improve behavior.
Should SPY be my whole portfolio?
SPY can be a strong core holding, but it is focused on U.S. large-cap stocks. Many investors also consider international stocks, bonds, cash, and other assets depending on goals and risk tolerance.
Is SPY better than stock picking?
SPY is often better than casual stock picking because it is diversified and low-cost. A skilled investor can outperform, but stock picking requires a repeatable process, risk control, and the ability to hold through mistakes.
What is the biggest reason investors underperform SPY?
The biggest reason is usually behavior. Selling during downturns, chasing recent winners, sitting in cash for too long, and changing strategies too often can reduce the return an investor actually captures.
How can I compare my results with SPY fairly?
Use your real contribution dates, withdrawals, fees, taxes, and cash positions. A fair comparison should measure investor return, not only the fund return shown on a simple chart.