Why Most Investors Underperform the Market
Why most investors underperform the market is not a mystery of intelligence. It is a behavior problem. Investing rewards patience, process, costs, and emotional control - while real people react to fear, headlines, overconfidence, and short-term pain.
Decision Framework: Why Do Most Investors Underperform the Market?
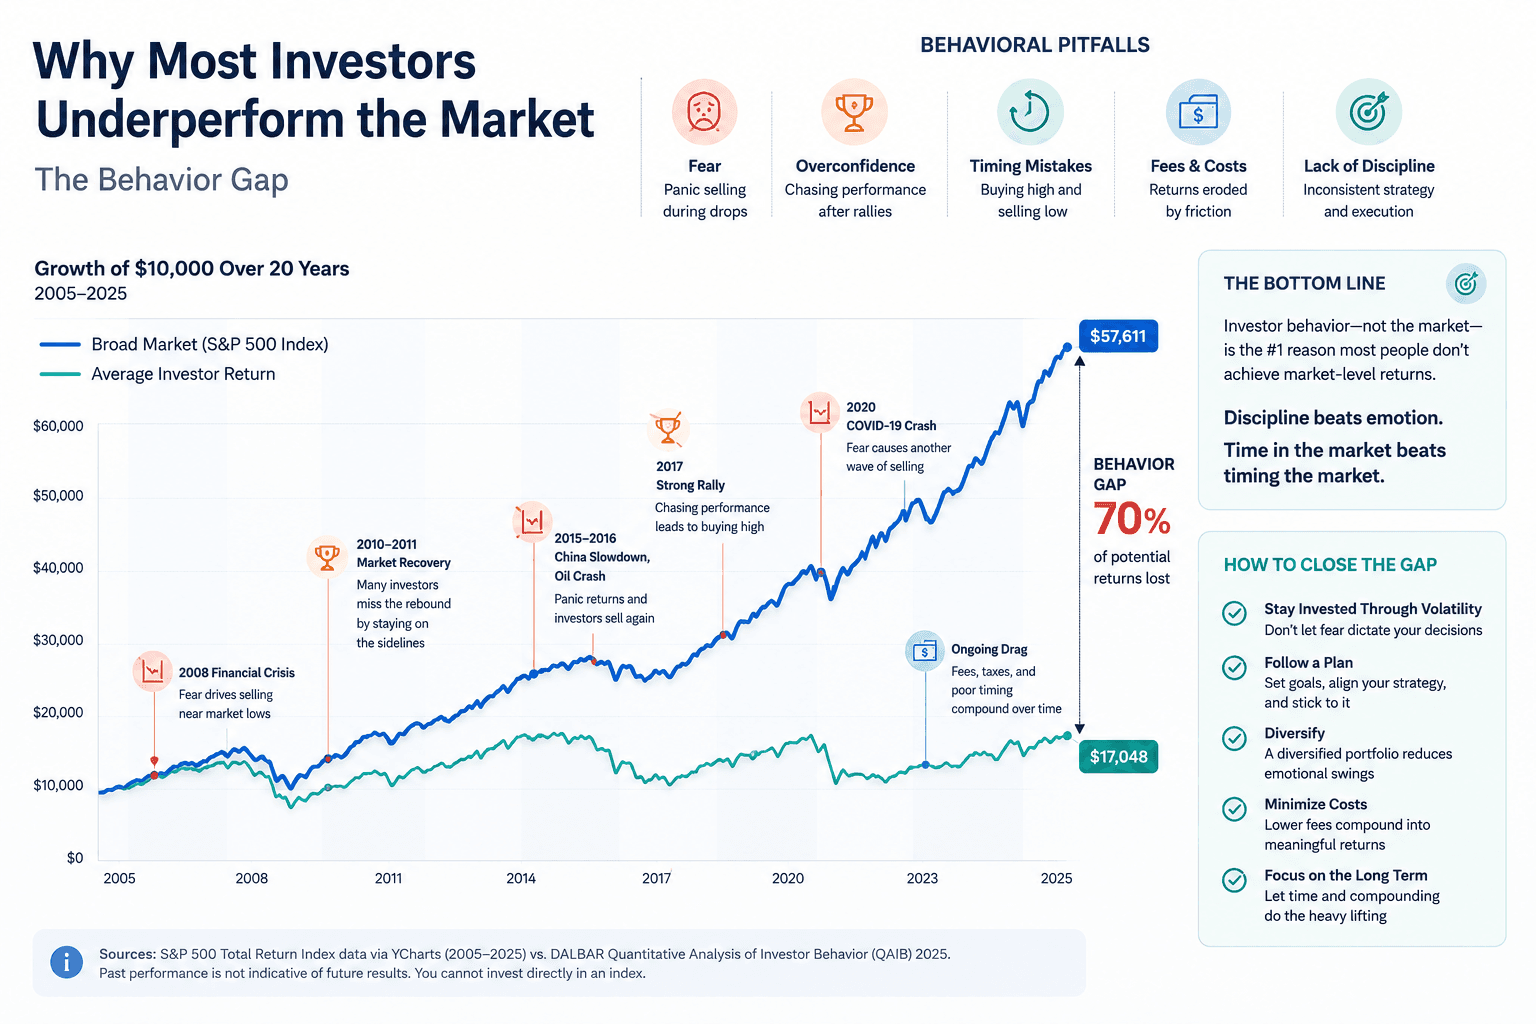
Why most investors underperform the market comes down to a simple gap: their actual behavior is worse than their intended strategy. They buy after strong performance, sell after scary declines, change plans too often, pay unnecessary fees, hold concentrated positions, and underestimate how much a few emotional decisions can damage long-term compounding. The market return is what an index earns. The investor return is what a person actually captures after timing mistakes, costs, taxes, and panic.
The uncomfortable truth is that the average investor can own good assets and still get poor results. A low-cost ETF can be an excellent tool, but it does not prevent someone from selling during a crash, stopping contributions after bad news, chasing last year's best sector, or abandoning a plan after three disappointing months. The difference between a good portfolio and a good outcome is behavior, which is the core reason why most investors underperform the market.
Main cause
Emotional timing: buying high, selling low, and reacting to volatility instead of following a plan.
Hidden drag
Fees, taxes, turnover, and cash drag quietly reduce returns even when asset selection is reasonable.
Best fix
Use rules, automation, diversification, and low-cost vehicles so decisions are made before stress arrives.
Trusted Research Behind the Behavior Gap
This framework is consistent with investor education from public and industry sources. The SEC explains why investors should understand diversification, FINRA highlights common investor mistakes and risks, and Investor.gov provides guidance on how stock markets work. Those references support the same core lesson: process, costs, diversification, and behavior often matter as much as asset selection.
The Market Return vs Investor Return Gap
The phrase “investors underperform the market” can be misunderstood. It does not mean every investor loses money. It means many investors earn less than the funds, indexes, or strategies they try to follow. The gap happens because a fund's published return assumes the investment was held for the full period. A human investor's return depends on when money entered, when money left, and whether the person stayed invested during the hardest periods. This is why most investors underperform the market even when they use reasonable investments, and it is why the question of why most investors underperform the market should be treated as a behavior problem first.
Imagine two people use the same S&P 500 ETF. The first invests monthly for 20 years and does not change the plan. The second buys aggressively after strong markets, pauses contributions when headlines turn negative, sells after a major drawdown, waits for “clarity,” and re-enters after prices have already recovered. Both used the same market vehicle, but their outcomes can be completely different.
| Return type | What it measures | Why it matters |
|---|---|---|
| Market return | The return of an index or fund over a period. | Shows what the asset delivered. |
| Investor return | The return investors actually earned based on cash flows. | Shows what behavior captured. |
| Behavior gap | The difference between the two. | Reveals the cost of timing, panic, chasing, and inconsistency. |
This is why performance charts can be misleading. A chart can show a smooth long-term line, but no investor lives inside the chart. Real investors experience layoffs, inflation, news cycles, family pressure, social media hype, and fear. The real question is not simply “which asset had the best return?” It is “which strategy can I actually hold when it becomes uncomfortable?”
Who Is Most Likely to Underperform?
The phrase “average investor” hides several different behaviors. Some people underperform because they trade too much. Others underperform because they hold too much cash. Others concentrate in a few exciting ideas. Others use good funds but abandon them at the worst moment. Understanding your own pattern matters more than blaming a generic investor category. In practice, why most investors underperform the market often depends on which behavior pattern repeats the most.
The panic seller
This investor can tolerate risk in theory, but not in real time. When the portfolio falls sharply, the pain becomes too loud. Selling creates relief, but it often happens after much of the damage is already visible.
The performance chaser
This investor buys whatever recently worked: technology after a boom, crypto after a surge, dividend stocks after a rotation, or cash after a selloff. The portfolio always feels current, but often arrives late.
The over-optimizer
This investor keeps changing funds, factors, allocations, and strategies. Each change looks rational on its own. Together they create churn, taxes, confusion, and no durable process.
The disciplined accumulator
This investor may not have the most exciting portfolio, but has the strongest process: automatic contributions, low fees, broad exposure, periodic review, and fewer emotional decisions.
The goal is not to become a genius investor. The goal is to stop being the investor who repeatedly interrupts compounding. If you can avoid the biggest mistakes, you do not need to predict every cycle perfectly. You simply need a process that keeps you participating when participation feels uncomfortable. That is why most investors underperform the market less when their rules are written before stress arrives.
The Behavioral Biases That Hurt Investor Returns
Behavioral finance exists because investors are human. We dislike losses more than we enjoy gains. We trust recent data too much. We feel safer in crowds. We confuse confidence with skill. These biases are not moral failures. They are predictable mental shortcuts. The problem is that markets often punish them.
Loss aversion
Investors feel losses intensely, so they sell to stop emotional pain. Unfortunately, selling after a decline can turn temporary volatility into permanent loss.
Recency bias
Recent performance feels more important than long-term evidence. Investors chase the asset that just worked, often after much of the easy gain is gone.
Herd behavior
When everyone talks about the same asset, it feels safer to join. Crowds can provide comfort, but not valuation discipline.
Overconfidence
Many investors believe they can spot tops and bottoms. In practice, timing requires being right twice: when to exit and when to re-enter.
The most dangerous bias is often not fear or greed alone. It is the belief that your emotional reaction is actually analysis. A crash can make selling feel logical. A hot asset can make chasing feel rational. A quiet diversified portfolio can feel boring precisely because it is doing its job. This is why most investors underperform the market even when their mistakes feel reasonable in the moment.
Market Timing Is Harder Than It Looks
Market timing is seductive because it sounds obvious in hindsight. Looking backward, it seems easy to identify bubbles, crashes, recoveries, and perfect entry points. Living through those moments is different. During a decline, the future feels uncertain. During a rally, prices feel expensive. During a sideways market, patience feels unrewarded.
The hardest part of timing is that the best days often cluster near the worst days. If an investor sells after a sharp decline, they may avoid some short-term pain, but they also risk missing the early rebound. Missing a small number of powerful recovery days can reduce long-term results dramatically. This is one reason time in the market often beats timing the market for ordinary investors, and one reason why most investors underperform the market when they repeatedly try to exit and re-enter.
Exit decision
You must know when risk is too high.
Re-entry decision
You must know when fear has gone too far.
Behavior decision
You must follow the plan while emotions disagree.
For most people, a better approach is not perfect timing. It is a predefined contribution and rebalancing rule. Dollar-cost averaging can help because it turns market volatility into a schedule instead of a debate. To compare this idea with historical data, use the DCA Calculator or run a scenario in the Investment Simulator.
Fees, Taxes, and Turnover Quietly Reduce Performance
Not every cause of underperformance is emotional. Some are structural. High expense ratios, advisory fees, trading costs, bid-ask spreads, taxable turnover, and unnecessary product complexity can reduce results even when the investor behaves reasonably. A 1% fee may look small in a single year, but over decades it can remove a large share of compounded wealth. This cost layer is another overlooked reason why most investors underperform the market.
Costs matter because they are one of the few variables investors can control. You cannot control next year's market return. You cannot control inflation, interest rates, or headlines. But you can often control fund costs, trading frequency, tax location, and whether you use simple instruments or expensive products.
| Cost | How it hurts | Better behavior |
|---|---|---|
| High fund fees | Reduce returns every year, whether markets rise or fall. | Use low-cost ETFs for core exposure. |
| Excessive trading | Adds spreads, possible taxes, and timing errors. | Trade less and rebalance on rules. |
| Taxable turnover | Can create tax bills before wealth compounds. | Hold tax-efficient funds where possible. |
| Cash drag | Money waiting for the “perfect entry” may miss market growth. | Use staged entry or automated contributions. |
Concentration Risk: Another Reason Investors Lag the Market
Some investors underperform because they own too little of the market. They concentrate in one stock, one sector, one country, or one story. Concentration can create spectacular gains when the bet works, but it can also create long periods of underperformance or permanent loss when the story breaks.
Diversification is not exciting, and that is part of its strength. A diversified portfolio admits that the future is uncertain. It does not require you to pick every winner. It gives you exposure to many companies, sectors, and regions so a single mistake does not define your financial life.
Too concentrated
One stock, sector, or theme controls the outcome. Confidence feels high until the cycle turns.
Better diversified
Broad ETFs, multiple asset classes, and balanced exposure reduce single-story risk.
Still intentional
Diversification does not mean owning everything randomly. It means risk is allocated deliberately.
If your strategy uses recurring contributions, diversification matters even more. New contributions should not automatically chase the most exciting asset. A diversified DCA portfolio can reduce regret, smooth the experience, and make it easier to keep investing when one holding is struggling.
Why Crashes Create the Biggest Investor Return Gap
Most investors do not abandon their plan on calm days. They abandon it when losses feel personal, when the news is frightening, and when friends or social media make fear feel like consensus. This is why market crashes are so important. A crash is not only a price event. It is a behavior test.
During a drawdown, the future feels less like an opportunity and more like a threat. Cash feels safe. Waiting feels prudent. Selling feels like control. But if an investor sells after a decline, they now need a second decision: when to get back in. Re-entry is often harder than exit because the recovery begins before the news feels safe again.
| Crash behavior | Why it feels reasonable | Why it can hurt | Better rule |
|---|---|---|---|
| Selling after a major decline | Stops emotional pain. | May lock in losses and miss recovery. | Rebalance only on a predefined schedule or threshold. |
| Stopping contributions | Avoids buying into uncertainty. | Misses lower prices and reduces future share accumulation. | Keep automatic contributions unless income is at risk. |
| Waiting for clarity | Feels safer than acting during panic. | Markets often recover before clarity arrives. | Use staged investing instead of all-or-nothing timing. |
| Changing strategy mid-crash | Feels like adapting. | Often replaces a long-term plan with a short-term emotion. | Write crisis rules before the crisis. |
A written crash rule can be simple: continue contributions, rebalance if allocation drifts beyond a set band, keep emergency cash separate, and do not sell equities because of headlines alone. This kind of rule may sound boring, but it is designed for the exact moment when intelligence is not enough and nerves matter. Without that rule, why most investors underperform the market becomes painfully visible during crashes.
How to Stop Underperforming the Market
The solution is not to become emotionless. The solution is to design a system that does not depend on perfect emotional control. Good investing systems make the right behavior easier before the market becomes stressful. Once you understand why most investors underperform the market, the next step is to remove the repeatable decisions that cause the gap.
Write an investment policy
Decide your target allocation, contribution schedule, rebalancing rule, and selling rules before volatility arrives.
Automate contributions
Automation removes the monthly debate. It also prevents headlines from controlling whether you invest.
Use low-cost core funds
Keep the core simple. Expensive products must prove they are worth their fee, not merely sound sophisticated.
Review less often
Checking too frequently can make normal volatility feel like actionable information.
The best rule is the one you will actually follow. Some investors need a simple one-fund ETF. Others need a written rebalancing schedule. Others need a monthly DCA plan. Advanced investors may want to test multiple scenarios, fees, withdrawals, and benchmarks using Premium access. The goal is the same: fewer emotional decisions and more repeatable behavior.
A Simple Investor Policy Statement
An investor policy statement does not need to be complex. It is a short document that tells future you what current you decided while calm. It can be one page. The value is not literary elegance. The value is that it reduces improvisation when markets are emotional.
Allocation rule
Define your target mix: for example, global equity ETF, bond ETF, cash reserve, and any satellite allocation.
Contribution rule
Define when money is invested: monthly, biweekly, or after each paycheck. Remove headline-based decisions.
Rebalancing rule
Define when you rebalance: annually, quarterly, or when an asset drifts beyond a specific band.
Selling rule
Define what justifies selling: goal reached, allocation change, tax plan, or fundamental life change, not panic.
Cash rule
Define emergency cash separately so market volatility does not threaten short-term needs.
Review rule
Define how often you review performance. Too much checking can turn noise into action.
This document is especially useful for investors who know they are emotional. A plan does not remove fear, but it gives fear less authority. The best time to write the plan is before the next scary headline.
30-Day Plan to Improve Investor Returns
If you want to close the gap between market returns and investor returns, do not start by predicting the next market move. Start by removing the behaviors that repeatedly damage compounding. The first 30 days should focus on clarity, automation, costs, and rules.
Week 1
Audit current holdings, fees, account types, cash drag, and any concentrated bets that control your outcome.
Week 2
Choose a target allocation and contribution schedule. Automate at least one recurring investment.
Week 3
Write your crash rule: what you will do during a 20%, 30%, or 40% drawdown.
Week 4
Reduce one source of drag: high fees, unnecessary trades, overchecking, or performance chasing.
The goal is not to fix everything in a month. The goal is to replace one fragile habit with one durable system. Over time, that is how investor returns improve: not through one brilliant forecast, but through fewer self-inflicted mistakes. The practical answer to why most investors underperform the market is usually to remove the decision points that cause repeated damage.
Reader Questions: What Should You Actually Do Differently?
Many articles explain why most investors underperform the market, but readers often need more than a diagnosis. They need to know what to do on Monday morning, what to do during a crash, and how to know whether their current strategy is fragile. These practical questions matter because investor behavior is not improved by information alone. It improves when information becomes a rule.
Should I stop checking my portfolio?
You do not need to ignore your portfolio forever, but daily checking can turn normal volatility into emotional pressure. For long-term investors, a monthly or quarterly review is often enough. If frequent checking makes you want to trade, the checking habit is not harmless.
Should I sell when the market looks expensive?
Selling because valuations feel high can create the second problem of re-entry. A better rule is to rebalance if your allocation has drifted too far, keep new contributions systematic, and avoid all-or-nothing calls based on headlines.
What if I already made a bad timing decision?
Do not try to repair one timing mistake with another impulsive timing decision. Rebuild a plan. Decide whether to re-enter gradually, set a contribution schedule, and document the rule you will follow next time.
How do I know if I am chasing performance?
If the main reason you want to buy something is that it recently went up a lot, pause. Ask whether the asset fits your written allocation or whether you are simply reacting to recent returns.
The answer to why most investors underperform the market is not that markets are impossible. It is that market participation is emotionally difficult. Once you accept that, the solution becomes clearer: build a process that assumes you will feel fear, greed, impatience, and regret. Then make the process strong enough to survive those emotions.
Examples of Underperformance in Real Life
Investor underperformance often looks small in the moment. It rarely starts with one dramatic mistake. It usually starts with a few reasonable-sounding decisions that compound in the wrong direction.
| Investor decision | Short-term feeling | Long-term risk | Better alternative |
|---|---|---|---|
| Pausing contributions during a bear market | Feels cautious | Misses lower purchase prices | Keep contributions if income is stable |
| Selling after a 25% decline | Feels protective | Locks in loss and creates re-entry problem | Rebalance by rule |
| Moving to cash after bad news | Feels safe | Cash can become a permanent allocation by accident | Keep emergency cash separate from investment strategy |
| Buying last year's winner | Feels informed | Can buy after valuation expansion | Use target allocation and contribution rules |
| Switching strategies every year | Feels optimized | Never lets one process compound | Choose a strategy and define review intervals |
These examples show why most investors underperform the market without necessarily doing anything that looks foolish in isolation. Each action can feel reasonable at the time. The damage comes from repeating these actions across cycles.
The Anti-Underperformance Checklist
Use this checklist before making any major portfolio change. It is designed to slow down emotional decisions and force the question that matters most: am I improving the plan, or am I reacting to discomfort?
Before buying
Does this investment fit my target allocation, or am I chasing recent performance?
Before selling
Am I selling because my plan changed, or because the price moved against me?
Before pausing
Is my income or emergency fund at risk, or am I stopping contributions because headlines feel scary?
Before switching strategy
Did the strategy fail, or did I fail to give it enough time?
Before increasing risk
Would I still hold this allocation after a 30% decline?
Before checking again
Will this information change a planned action, or only increase anxiety?
Use Tools to Replace Emotion With Evidence
One reason investors underperform the market is that they make decisions from memory and emotion instead of evidence. A tool cannot predict the future, but it can show how a strategy behaved across past periods, contributions, drawdowns, and assumptions. That evidence can make it easier to stay disciplined.
Investment Simulator
Backtest historical scenarios and compare how different choices behaved through real market periods.
Premium workflow
Compare portfolios, fees, benchmarks, withdrawals, reports, and saved scenarios.
The Best Investor Is Often the Most Repeatable Investor
Underperformance usually comes from avoidable decisions repeated over time: panic selling, performance chasing, overtrading, high fees, and abandoning a plan. The antidote is not prediction. It is process.
Frequently Asked Questions
Why do most investors underperform the market?
Most investors underperform the market because of emotional timing, performance chasing, high costs, poor diversification, excessive trading, taxes, and inconsistent behavior during volatility.
Is underperformance mostly caused by bad stock picking?
Stock picking can contribute, but behavior is often more important. Investors can own good funds and still get poor results if they buy and sell at the wrong times.
Does dollar-cost averaging help investors avoid underperformance?
Dollar-cost averaging can help by creating a repeatable contribution schedule. It does not guarantee better returns, but it can reduce timing mistakes and make investing easier to sustain.
How can I improve my investor returns?
Use a written plan, automate contributions, lower fees, diversify, rebalance on rules, avoid frequent checking, and test assumptions with historical simulations before making emotional changes.
Should I try to beat the market?
Most investors should first focus on capturing market returns consistently. Beating the market is difficult, but reducing self-inflicted mistakes can be a more realistic and valuable goal.
Related Guides
Time beats timing
Learn why long-term behavior can matter more than perfect entry points.
Timing vs DCA
Compare market timing with recurring investing and see why consistency matters.
SPY vs average investor
See how a simple benchmark can outperform when behavior, fees and timing mistakes are included.
SPY crash recovery
See how investors were rewarded or punished for behavior during major drawdowns.