DCA SP500: What If You Had Invested Every Month?
DCA SP500 is one of the clearest examples of dollar-cost averaging in action. This guide looks at what a simple $100 monthly contribution could have become, why the journey was not smooth, and how to test the same idea with your own numbers.
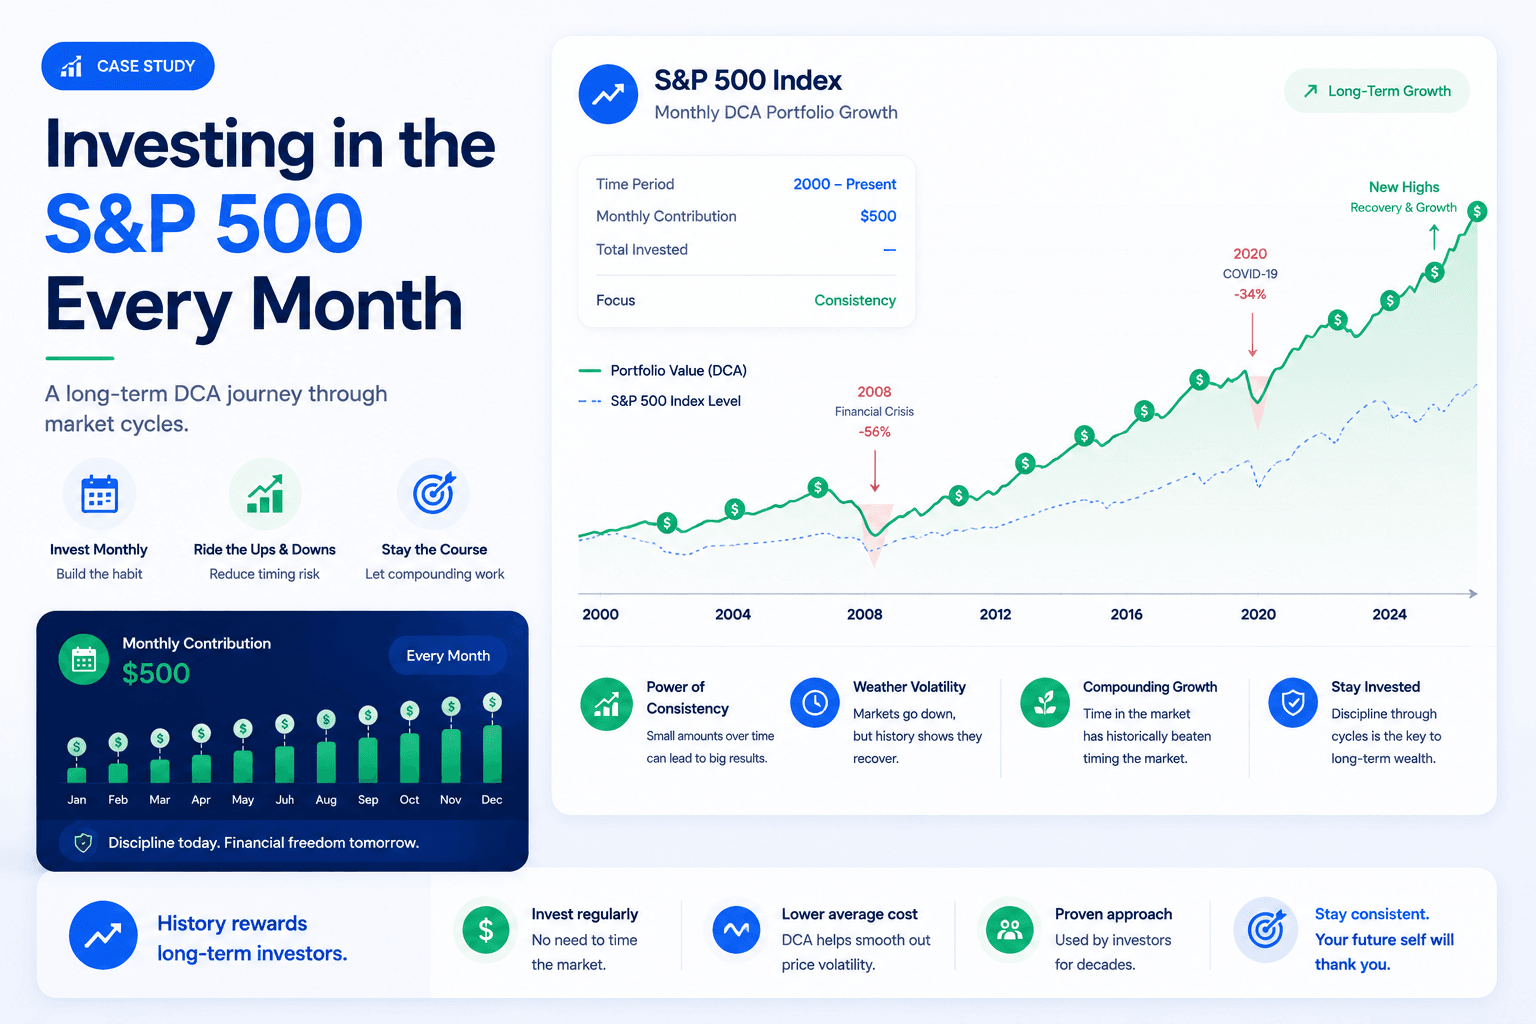
A simple $100 monthly habit can become a six-figure portfolio.
Illustrative SPY-based calculation using WhatIfInvested market-history data through May 2026. Results vary by start date, fund, dividend handling, fees, taxes, and contribution timing.
Simple recurring contribution.
Approximate contributions from 2000 to May 2026.
Approximate SPY price-based result.
Most value came from persistence, not perfect timing.
Important: this is an educational backtest-style estimate, not a promise of future results. Use the simulator to test your own exact assumptions.
What this DCA SP500 case study really means
When people ask what would have happened if they had invested in the S&P 500 every month, they are usually asking a deeper question: would consistency have been enough? The answer is often yes, but not because the path was smooth. DCA SP500 has delivered strong long-term lessons across many historical windows, but investors who dollar-cost averaged through it still had to live through crashes, recessions, inflation scares, valuation debates, and long periods where progress felt slow.
Dollar-cost averaging into the S&P 500 means investing a fixed amount into a fund that tracks large U.S. companies at regular intervals. A common example is buying an S&P 500 ETF such as SPY, VOO, or IVV every month. The investor is not trying to predict the best entry point. The investor is building market exposure over time.
This DCA SP500 article uses the S&P 500 as a case study because it is one of the most widely followed benchmarks in the world. It represents large U.S. companies across sectors such as technology, financials, healthcare, consumer businesses, industrials, and communication services. It is not the entire global market, and it is not risk-free, but it is a useful lens for studying long-term equity compounding.
Invest every month
The contribution schedule removes the need to decide whether each month is the perfect buying opportunity.
Use broad exposure
An S&P 500 fund spreads the investment across hundreds of large U.S. companies.
Expect volatility
The long-term result can look clean on a chart, but the investor experience includes painful drawdowns.
The biggest mistake is treating the S&P 500 as a straight line. A monthly investor from 2000 onward had to buy through the dot-com bust, the global financial crisis, the COVID crash, the inflation and rate shock of 2022, and many smaller corrections. The final number matters, but the behavioral journey matters too.
The numbers behind a DCA SP500 monthly investment
Using a simple SPY-based price history estimate, a $100 monthly investment from the start of 2000 through May 2026 would have required roughly $31,700 in total contributions. The estimated ending value was about $139,000 before taxes, personal fees, and any differences caused by exact execution date, dividend handling, or fund choice.
This DCA SP500 result is not meant to be a universal number. It is a case study. If the investor started in a different month, used a different S&P 500 ETF, bought on a different day, reinvested dividends differently, paid fees, or stopped contributions during drawdowns, the result would change. The point is to understand the forces behind the outcome.
| Case study input | Approximate value | Why it matters |
|---|---|---|
| Monthly contribution | $100 | Small enough to be realistic for many beginners. |
| Contribution period | 2000 to May 2026 | Includes multiple market regimes, crashes, and recoveries. |
| Total invested | About $31,700 | The investor built exposure gradually rather than all at once. |
| Estimated ending value | About $139,000 | Shows the impact of long-term equity compounding. |
| Main risk | Large drawdowns | The investor had to keep contributing when the strategy felt uncomfortable. |
Why the ending value can surprise people
The ending value surprises many readers because $100 per month feels small. But time changes the math. Early contributions get many years to compound. Later contributions have less time, but they keep adding fuel to the portfolio. Over a multi-decade period, the combination of recurring deposits, market growth, and recovery after downturns can create a result that feels much larger than the monthly effort.
The return is not evenly distributed. Some years do a lot of work. Strong bull markets after major declines can move the portfolio sharply higher. Periods like the post-2009 recovery and the long growth cycle that followed were especially important. This is why quitting during a crash can be so costly: the recovery often does not announce itself in advance.
The real journey was not smooth
Looking backward, the result can seem obvious: invest monthly, wait long enough, and let compounding work. Living through it would not have felt that easy. The period from 2000 onward contained several moments when investors had strong reasons to doubt stocks, doubt the economy, or doubt their own plan.
A monthly investor starting around 2000 entered near a difficult period for U.S. equities. The dot-com bubble had created high expectations, then the market declined sharply. A new investor could have spent the first years contributing into losses. That is a tough psychological test. Yet those lower purchase prices also allowed later recovery to work harder.
The global financial crisis was another major test. A portfolio that had recovered from the early 2000s faced another deep drawdown. Many investors sold or stopped buying. A disciplined DCA investor kept adding shares at lower prices. That did not make the crisis painless, but it changed the long-term share accumulation.
Three phases of the journey
Contributions matter most
Early on, new deposits can be more important than market movement because the account is still small.
Returns start to matter
As the portfolio grows, market performance begins to move the account more than each monthly contribution.
The portfolio has momentum
Eventually, a strong or weak year can move the account by more than several years of deposits.
This phase shift is one of the most important lessons. At the start, $100 per month feels like the whole strategy. Later, the accumulated portfolio becomes the engine. This is why investors often underestimate the value of starting early. Early contributions may look small, but they help create the base that later compounds.
Drawdowns are the price of long-term equity returns
The S&P 500 has rewarded long-term investors historically, but it has not done so politely. Any serious DCA SP500 plan must be built with drawdowns in mind. A drawdown is the decline from a previous high to a later low. For an investor, drawdowns are where theory becomes behavior.
A monthly investor in an S&P 500 fund had to keep contributing through periods when account values fell, headlines were negative, and the future felt uncertain. The most important question is not whether drawdowns happen. They do. The question is whether your plan is strong enough to survive them.
| Market period | Investor experience | DCA lesson |
|---|---|---|
| Dot-com bust | Early investors saw weak returns soon after starting. | Starting near a market peak can feel discouraging, but lower prices improve future purchases. |
| Global financial crisis | Broad fear, job risk, and portfolio losses arrived together. | A DCA plan requires cash-flow resilience, not just optimism. |
| COVID crash | The market fell quickly and recovered quickly. | Stopping contributions can miss both lower prices and fast recoveries. |
| Inflation and rates shock | Stocks and bonds both faced pressure. | Risk tolerance should be reviewed before volatility arrives. |
Why the investor's behavior matters more than the spreadsheet
The spreadsheet assumes every monthly contribution happens. Real people sometimes stop. They lose confidence. They need cash. They read bad news. They decide to wait until things feel safer. But markets often recover before the news feels safe. The best DCA plan is the one the investor can actually follow when it feels uncomfortable.
That is why an emergency fund, stable cash flow, and a realistic monthly amount matter. If $100 per month is sustainable, it can keep going. If the investor chooses an amount that is too aggressive, the plan may break during the first stressful period. A smaller contribution that lasts is often better than a bigger contribution that disappears.
Lessons from monthly S&P 500 investing
This DCA SP500 case study is not only about the S&P 500. It is about how recurring investing behaves over a long period. The same broad lessons apply to many diversified equity plans, though the exact results differ by asset, country, fees, taxes, and time period.
Small contributions can become meaningful
A monthly amount that looks modest at the beginning can matter when it is repeated for decades.
Crashes can help future contributions
Falling prices are painful, but new contributions buy more shares when prices are lower.
Fees quietly matter
Low-cost ETFs, low spreads, and avoiding unnecessary trading can improve net results over time.
Automation reduces decision fatigue
The fewer times you must manually decide to invest, the less room there is for fear to interrupt the plan.
Dividend reinvestment changes the picture
S&P 500 funds distribute dividends. Over long periods, reinvested dividends can make a meaningful difference. If dividends are not reinvested, the growth path is weaker. If dividends are automatically reinvested, the investor buys more shares without adding extra cash. Many long-term return studies assume total return, meaning dividends are included.
When you compare results, pay attention to whether the data is price return or total return. A price-only chart can understate the long-term experience of an investor who reinvested dividends. On the other hand, taxes on dividends can reduce after-tax returns in taxable accounts. The right interpretation depends on account type and assumptions.
DCA into the S&P 500 vs investing a lump sum
The natural comparison is monthly DCA versus lump sum investing. If an investor had a large amount available at the beginning, investing it all at once often has a higher expected return in rising markets because more money is exposed earlier. But that is not the situation for many people. Most investors build wealth from paychecks, not from one giant starting amount.
For a paycheck investor, DCA is not a compromise. It is the practical way money becomes invested. The choice is usually not DCA versus lump sum. The choice is investing the monthly surplus or leaving it in cash. In that case, regular investing can be a strong default.
For someone with a bonus, inheritance, or large cash balance, the question is different. They can compare investing everything today against phasing in over several months. The right choice depends on risk tolerance, market conditions, regret risk, and the ability to stick to the plan.
| Situation | Likely better framing | Tool to use |
|---|---|---|
| Investing from salary | Automate monthly S&P 500 contributions. | DCA Calculator |
| Large cash balance | Compare lump sum against a defined phase-in schedule. | Investment Simulator |
| Multiple ETF choices | Compare S&P 500 against total market, Nasdaq, or global ETFs. | Premium tools |
| Need to account for fees | Model expense ratios, transaction costs, and scenarios. | Premium tools |
If you want to compare these paths with your own numbers, use the Investment Simulator. For deeper comparisons with multiple portfolios, benchmarks, fees, rebalancing, and saved reports, compare the Premium plans.
Reliable data sources for a DCA SP500 backtest
A useful DCA SP500 case study should be clear about the benchmark, the ETF proxy, and the assumptions behind the result. The S&P 500 itself is maintained by S&P Dow Jones Indices, while ETF providers such as Vanguard and State Street publish fund details for common S&P 500 ETF choices.
For practical investors, the key is not only the index return. The final result also depends on dividend reinvestment, expense ratio, contribution date, tax account, currency conversion, and whether the investor kept contributing during weak markets. That is why a backtest should be treated as a planning tool, not a guarantee.
How to build your own S&P 500 monthly investing plan
A good monthly S&P 500 plan should be simple enough to follow and specific enough to avoid hesitation. The goal is to define what you will buy, how much you will invest, how often you will contribute, and when you will review the plan.
- Choose the fund. Common S&P 500 ETF examples include SPY, VOO, and IVV. Compare expense ratios, spreads, account access, and currency considerations.
- Choose the contribution amount. Pick an amount that fits your budget after emergency savings and high-interest debt obligations.
- Automate the process. Set a recurring transfer or reminder so the decision is not rebuilt every month.
- Reinvest distributions where appropriate. Dividend reinvestment can help compounding, though taxes may matter in taxable accounts.
- Review annually. Check whether the monthly amount should increase, whether your allocation still fits, and whether your goals changed.
Do not let the S&P 500 become your entire financial plan
The S&P 500 is broad, but it is still U.S. large-cap equity exposure. It does not include every global market, every asset class, or every risk profile. Some investors may want international stocks, bonds, cash reserves, or other diversifying assets. Others may be comfortable with a simple equity-heavy portfolio because they have a long horizon and strong risk tolerance.
The right plan is not only about return. It is about whether the portfolio matches your life. A 25-year-old investing for retirement has a different risk profile than a family saving for a near-term house down payment. DCA is an implementation method. It does not replace asset allocation.
Taxes, dividends, and account type can change the result
A headline S&P 500 DCA result is useful, but it can hide a major detail: the investor's real outcome depends on the account where the investment is held. A tax-advantaged account and a taxable account can lead to different after-tax results even when the same ETF is used. The market return may be identical, but the investor's net return can be different.
Dividends are especially important. Many S&P 500 return studies assume dividends are reinvested. That means each distribution buys more shares, which then participate in future growth. If dividends are spent instead of reinvested, the portfolio value shown on a long-term chart will usually be lower. If dividends are reinvested in a taxable account, the investor may still owe tax along the way depending on their country, account type, and personal situation.
After-tax return matters
Dividends, capital gains, and currency conversion can reduce what the investor keeps.
Compounding may be cleaner
Accounts such as IRAs, 401(k)s, RRSPs, or TFSAs can change the tax treatment of growth and withdrawals.
Small payments add up
Reinvested dividends can become a meaningful part of long-term equity wealth building.
Fees also deserve attention. A low expense ratio looks small in one year, but it compounds against the investor for decades. Transaction commissions, foreign exchange fees, bid-ask spreads, and platform costs can all affect net results. This is one reason S&P 500 ETFs are popular: many have low fees and strong liquidity. Still, the investor should compare the exact product available in their brokerage account.
Canadian investors also need to think about currency and account location. A U.S.-listed ETF, a Canadian-listed S&P 500 ETF, and a currency-hedged version can behave differently after fees, withholding tax, and exchange-rate movement. A U.S. investor may focus more on expense ratio and tax efficiency. A Canadian investor may also compare VFV, VOO, IVV, SPY, CAD exposure, and whether the account is taxable, TFSA, RRSP, or FHSA.
Is the S&P 500 enough, or should you diversify beyond it?
The S&P 500 is diversified across hundreds of companies, but it is not diversified across everything. It is mainly U.S. large-cap equity exposure. That can be powerful, but it also means the investor is making a strong bet on U.S. companies, U.S. market leadership, the U.S. dollar for non-U.S. investors, and the sectors that dominate the index at a given time.
For many investors, an S&P 500 fund can be a core holding. For others, it may be only one part of a broader portfolio that includes international stocks, bonds, cash, real estate exposure, or other assets. The decision depends on time horizon, income stability, withdrawal needs, and the ability to tolerate volatility.
| Portfolio approach | What it emphasizes | Potential tradeoff |
|---|---|---|
| S&P 500 only | Simple U.S. large-cap exposure with low complexity. | Less exposure to international markets and smaller companies. |
| Total U.S. market | Adds mid-cap and small-cap companies alongside large caps. | Still mostly tied to U.S. equity performance. |
| Global equity portfolio | Includes U.S. and international companies. | May underperform the S&P 500 during periods of U.S. leadership. |
| Balanced portfolio | Combines stocks with bonds or cash-like assets. | May reduce volatility but also reduce long-term expected growth. |
The right question is not whether the S&P 500 is good or bad. The better question is whether it is the right amount of risk for the job. A young investor with decades before retirement may accept a high stock allocation. Someone investing for a down payment in three years should be much more cautious. A retiree drawing income from a portfolio must think about sequence risk, not only long-term average return.
This is where scenario testing becomes useful. One backtest can show what happened to the S&P 500. A better workflow compares alternatives: S&P 500 versus total market, U.S. versus global, equity-only versus balanced, DCA versus lump sum, and low-fee versus high-fee versions. Premium tools are most useful when the investor is no longer asking only “what happened?” but “which portfolio fits my real plan?”
What if you increase your monthly investment over time?
The $100 monthly DCA SP500 example is intentionally simple, but real investors often increase contributions as their income grows. A person may start with $50 or $100 per month, then move to $200, $500, or more after debt is paid off, income rises, or budgeting improves. Increasing contributions can be one of the most powerful upgrades to a DCA plan because it combines market compounding with personal cash-flow growth.
There are two ways to think about increases. The first is a fixed raise, such as adding $25 to the monthly contribution every year. The second is a percentage raise, such as investing part of every salary increase. The second method can be easier psychologically because the investor improves the plan before lifestyle spending absorbs the new income.
Start small, then step up
A sustainable $100 monthly habit can become $150, $200, or $300 as the investor gains confidence and cash flow improves.
Automate contribution raises
Link increases to pay raises, debt payoff milestones, or annual budget reviews so the plan upgrades itself over time.
Contribution increases also reduce the pressure to find the perfect starting point. Many people delay investing because the first amount feels too small. But a small beginning is not a small plan if it becomes a durable system. The habit is the first asset. Once the habit is in place, the investor can improve the numbers.
This is also why budgeting and investing should work together. A monthly S&P 500 plan is easier when the investor knows where the cash will come from. Cutting one unused subscription may not create wealth by itself, but redirecting that money into an automated portfolio for years can matter. The more predictable the surplus, the easier it is to keep investing during stressful markets.
A simple annual review checklist
- Review the monthly amount. Can you increase it without weakening your emergency fund or creating debt?
- Check your asset allocation. Does the S&P 500 still fit your time horizon and risk tolerance?
- Review fees and account type. Are you using a low-cost fund in the most sensible account available to you?
- Test a new scenario. Compare your current plan against higher contributions, broader diversification, and a lower-return assumption.
- Protect the habit. Keep the plan simple enough that it can survive busy months and bad headlines.
The most useful long-term plan is usually not the most complex plan. It is a plan that starts, survives, and improves. A monthly S&P 500 investment can be a strong foundation, but the investor still has to manage behavior, cash flow, account choice, diversification, and expectations.
What monthly S&P 500 investors should monitor
A good DCA SP500 plan should not require constant checking, but it should not be completely ignored either. The purpose of monitoring is not to predict every market move. It is to make sure the plan still matches the investor's goals, cash flow, and risk tolerance. A monthly investor can review a few practical items without turning the strategy into daily market watching.
| Item to review | Good question to ask | Why it matters |
|---|---|---|
| Contribution amount | Can I raise it without creating financial stress? | Higher sustainable contributions can matter more than tiny return differences. |
| Emergency fund | Could I keep investing during a job loss or surprise expense? | DCA breaks when cash flow breaks. |
| Fund cost | Am I using a low-cost S&P 500 option? | Fees compound quietly over decades. |
| Portfolio concentration | Do I rely too heavily on one market or sector? | The S&P 500 can become concentrated in dominant companies and sectors. |
| Goal timeline | Is my money still meant for a long-term goal? | Equity-heavy investing is less suitable for near-term spending needs. |
One practical approach is to review the plan quarterly for cash-flow comfort and annually for strategy. A quarterly check can confirm that the automatic contribution is still affordable. An annual check can compare the S&P 500 plan with alternatives, update the monthly amount, and confirm that the investor is not taking more risk than intended.
Investors should also avoid confusing monitoring with reacting. Monitoring means understanding the plan. Reacting means changing the plan every time headlines become uncomfortable. The strongest DCA investors often do less than they think they need to do: they automate, review occasionally, rebalance when necessary, and avoid turning temporary volatility into permanent mistakes.
Test a different S&P 500 monthly amount in the Simulator
The result changes if you start in a different month, invest a different amount, use a different ETF, or stop during drawdowns. Run your own scenario instead of relying on one headline number.
Free Simulator
Backtest historical S&P 500 and DCA scenarios quickly.
DCA Calculator
Model recurring monthly contributions and future growth assumptions.
Premium tools
Compare weighted portfolios, fees, benchmarks, saved scenarios, and reports.
Common mistakes with S&P 500 DCA
Monthly DCA SP500 investing looks simple, but investors still make mistakes that reduce the benefits. The most common mistakes are behavioral, not mathematical.
Stopping contributions during crashes
The hardest months to invest are often the months that matter most. If prices fall and the investor stops buying, they lose the benefit of lower prices. DCA only works as a behavioral system if the schedule survives uncomfortable markets.
Choosing an amount that is too high
A contribution amount should be sustainable. If $500 per month forces the investor to raid emergency savings, it may be too aggressive. A smaller amount that continues for years is often stronger than a large amount that fails quickly.
Ignoring taxes and account type
Taxable accounts, retirement accounts, TFSA, RRSP, IRA, 401(k), and other account types can produce different after-tax results. The investment may be similar, but the net outcome can differ. This is especially important when dividends, currency conversion, and withdrawals are involved.
Assuming the past will repeat exactly
The S&P 500's historical record is impressive, but future returns can differ. Valuations, sector concentration, interest rates, inflation, and global competition can change outcomes. A good plan should be robust enough to handle lower-than-expected returns.
Frequently asked questions
What if I used DCA SP500 with $100 every month?
Using a SPY-based price history estimate from 2000 to May 2026, $100 per month would have required about $31,700 in contributions and could have grown to roughly $139,000 before taxes, personal fees, and exact execution differences.
Is DCA SP500 a good monthly investing strategy?
It can be a strong long-term strategy for investors who want broad U.S. equity exposure and can tolerate drawdowns. It should still fit your time horizon, risk tolerance, account type, and overall asset allocation.
Would lump sum have beaten monthly DCA?
Often, lump sum wins when markets rise after the start date because more money is invested earlier. But many investors do not have a lump sum available, and DCA can be easier to maintain emotionally.
Which S&P 500 ETF should I use for DCA?
Common examples include SPY, VOO, and IVV. The best choice depends on your broker, country, account type, expense ratio, spreads, and whether you need U.S.-listed or local-listed funds.
Can I use this strategy for retirement?
Yes, monthly S&P 500 investing can be part of a retirement plan, but retirement portfolios often need broader planning around bonds, international diversification, taxes, withdrawals, and sequence risk.
How can I test my own DCA SP500 scenario?
Use the WhatIfInvested Investment Simulator for historical backtests, the DCA Calculator for recurring contribution projections, or Premium tools for advanced portfolio comparisons.
Does DCA SP500 include dividends?
It depends on the data source and tool settings. A total-return calculation includes reinvested dividends, while a price-only ETF backtest can understate the long-term experience of an investor who reinvested distributions.
Is DCA SP500 better than trying to time the market?
For many long-term investors, DCA SP500 is easier to follow because it removes repeated timing decisions. It does not guarantee better returns than perfect timing, but it can reduce hesitation and help keep the plan consistent.
Educational simulation only. Historical performance does not guarantee future results. This article is educational, not financial advice. Results vary based on fund choice, dividends, fees, taxes, currency, contribution timing, and future market performance.