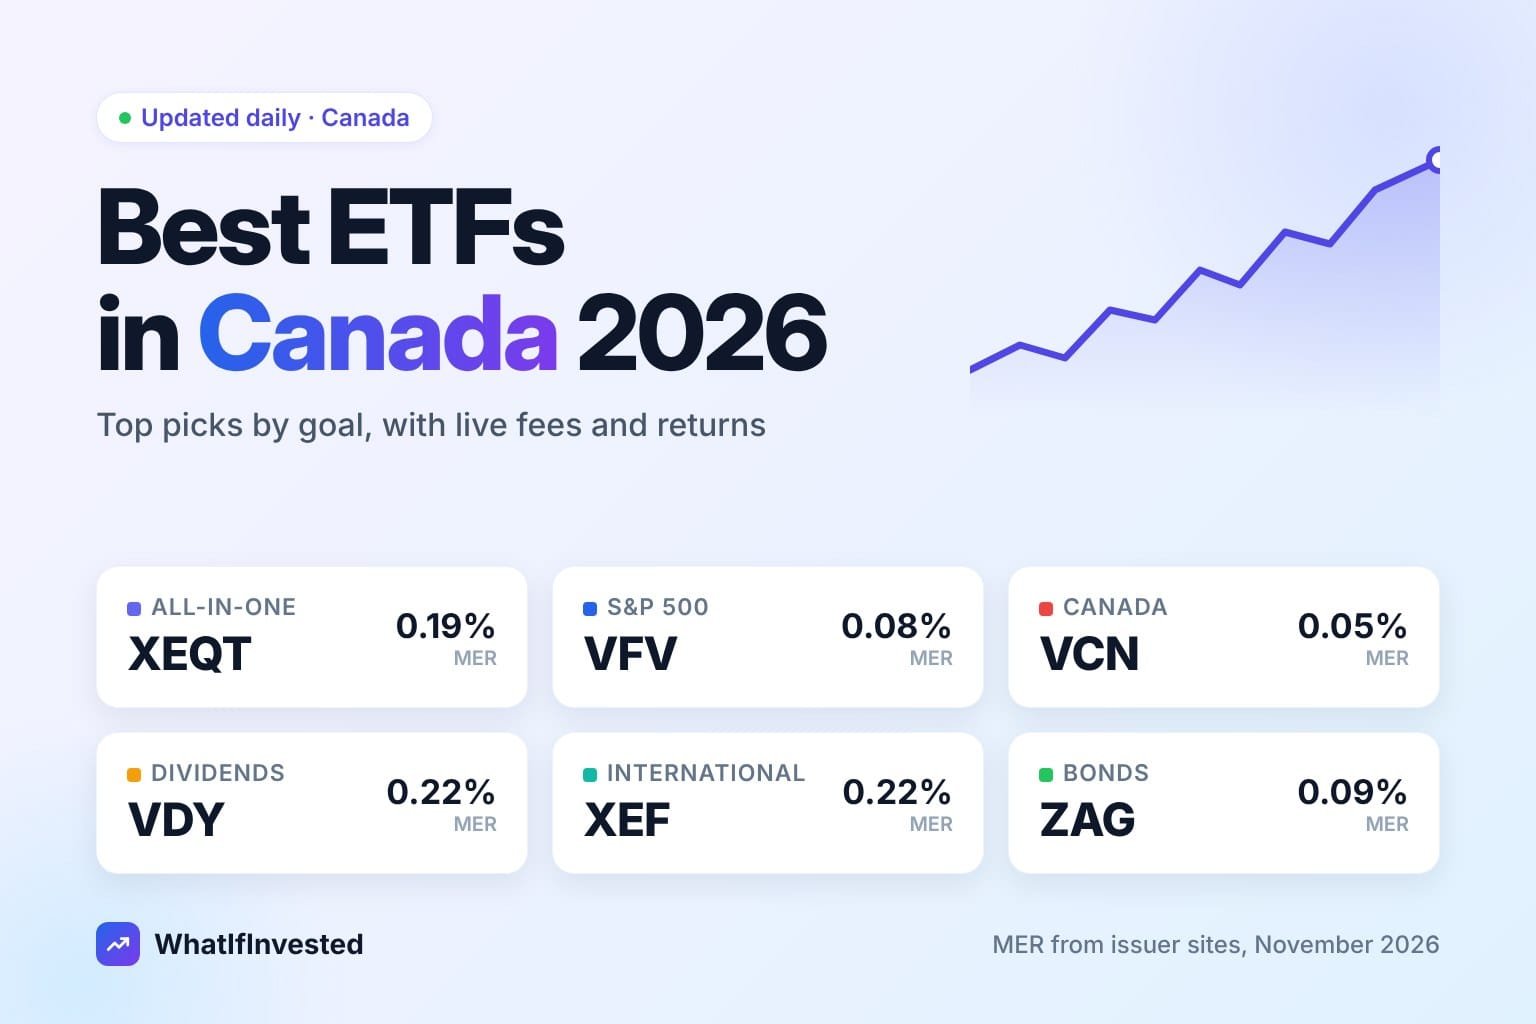
Quick answer: the best ETFs in Canada by goal
There is no single best ETF. The right one depends on the job it has to do in your portfolio. Most Canadians are well served by one all-in-one ETF. People who want more control usually combine three or four low-cost index ETFs. Everything else on this page is a variation on those two approaches.
| Your goal | Our first pick | Close alternatives | Why |
|---|---|---|---|
| One ETF, 100% stocks | XEQT | VEQT, ZEQT | Global stocks, automatic rebalancing, about 0.2% a year |
| One ETF with some bonds | VGRO or XGRO (80/20) | VBAL, XBAL (60/40) | Smaller drops in exchange for lower expected growth |
| S&P 500 in Canadian dollars | VFV | ZSP, XUS | 500 large U.S. companies for under 0.1% a year |
| Whole U.S. market | XUU | VUN | Adds mid and small U.S. companies to the S&P 500 |
| Canadian stocks | VCN | XIC, ZCN, XIU | The cheapest ETFs on the TSX, around 0.05% |
| Dividend income | VDY | XEI, CDZ, ZEB | Higher cash yield, but concentrated in banks and energy |
| Stocks outside North America | XEF | VIU; XAW for the world without Canada | Europe, Japan and Australia in one fund |
| Bonds | ZAG | VAB, XBB | The full Canadian bond market for under 0.1% |
| Tech growth | XQQ | ZQQ, QQQ | Nasdaq-100; a satellite holding, not a core one |
The live tables below show each fund's fees, five-year return, worst drop and yield. They update every day from issuer data and our price history, so you can check the picks against the numbers instead of taking our word for it.
How we chose these ETFs
We looked at the ETFs Canadians actually buy and kept the ones that pass five tests:
- Low cost. The management expense ratio (MER) is the only return you can predict. Every pick charges well under 0.4% a year, and most charge under 0.25%.
- Broad diversification. Index funds that hold hundreds or thousands of companies, not a handful of themes.
- Size and trading volume. Large funds from Vanguard, BlackRock (iShares) and BMO, with tight bid-ask spreads.
- Listed in Canada. You can buy them in CAD in a TFSA, RRSP or FHSA without converting currency. A separate section covers U.S.-listed ETFs, which can make sense in an RRSP.
- A clear role. Each ETF fills one job: growth, stability, income or a region.
We did not rank funds by last year's return. A fund that led last year is often just the one that held the sector that happened to rise. Past returns are shown for context, not as a forecast.
1. Best all-in-one ETFs: one ticker, a whole portfolio
An all-in-one ETF is a fund of index ETFs. It holds Canadian, U.S., international and emerging-market stocks, and sometimes bonds, then rebalances back to its target mix on its own. For most people this is the simplest good portfolio available: buy one fund every month and leave it alone.
| ETF | Fund | MER | 5-yr / yr | Worst drop | Yield |
|---|---|---|---|---|---|
| XEQTiShares Core Equity ETF Portfolio | iShares Core Equity ETF Portfolio | 0.19% | 9.6% | -29.7% (since 2019) | ~1.9% |
| VEQTVanguard All-Equity ETF Portfolio | Vanguard All-Equity ETF Portfolio | 0.22% | 10.0% | -30.5% (since 2019) | ~1.8% |
| ZEQTBMO All-Equity ETF | BMO All-Equity ETF | 0.18% | 18.3% (3 yr) | -18.4% (since 2022) | ~2.0% |
| XGROiShares Core Growth ETF Portfolio | iShares Core Growth ETF Portfolio | 0.19% | 7.4% | -50.1% (since 2007) | ~2.2% |
| VGROVanguard Growth ETF Portfolio | Vanguard Growth ETF Portfolio | 0.22% | 7.2% | -25.4% (since 2018) | ~2.2% |
| XBALiShares Core Balanced ETF Portfolio | iShares Core Balanced ETF Portfolio | 0.18% | 4.8% | -32.8% (since 2007) | ~2.4% |
| VBALVanguard Balanced ETF Portfolio | Vanguard Balanced ETF Portfolio | 0.22% | 4.6% | -21.2% (since 2018) | ~2.4% |
Live data: MER from the issuer; returns are price-only (dividends excluded) to 2026-11-17; worst drop is the largest peak-to-trough fall since the first price in our data, so funds with longer histories include 2008 or 2020; yield is approximate. Updated daily.
100% equity (XEQT, VEQT, ZEQT). For long horizons and people who can sit through a 30% fall without selling. The three are close substitutes. The main difference is how much they hold in Canada: VEQT keeps about 31% at home, XEQT about 26% and ZEQT about 25%. XEQT and ZEQT also hold a little more in emerging markets. Fees are within a few hundredths of a percent of each other, so pick one and stick with it. Our VEQT vs XEQT comparison goes through the differences in detail.
80/20 (VGRO, XGRO). About 20% bonds. Drops have been noticeably smaller than with the all-equity versions, at the cost of somewhat lower long-run growth.
60/40 (VBAL, XBAL). For people closer to spending the money, or who know they would panic in a crash. Balanced funds are the classic choice for a portfolio that has to be drawn down within ten years.
2. Best S&P 500 and U.S. stock ETFs in Canadian dollars
U.S. companies make up more than 60% of the world's stock market value. Many Canadians add a U.S. ETF on top of Canadian stocks, or hold one as a growth core.
| ETF | Fund | MER | 5-yr / yr | Worst drop | Yield |
|---|---|---|---|---|---|
| VFVVanguard S&P 500 Index ETF | Vanguard S&P 500 Index ETF | 0.08% | 12.1% | -27.7% (since 2012) | ~1.2% |
| ZSPBMO S&P 500 Index ETF | BMO S&P 500 Index ETF | 0.09% | 12.1% | -26.9% (since 2012) | ~1.2% |
| XUSiShares Core S&P 500 Index ETF | iShares Core S&P 500 Index ETF | 0.09% | 12.1% | -27.2% (since 2013) | ~1.3% |
| XUUiShares Core S&P U.S. Total Market Index ETF | iShares Core S&P U.S. Total Market Index ETF | 0.07% | 11.2% | -28.2% (since 2015) | ~1.3% |
| VUNVanguard Morningstar U.S. Total Market Index ETF | Vanguard Morningstar U.S. Total Market Index ETF | 0.16% | 11.0% | -28.2% (since 2013) | ~1.2% |
Live data: MER from the issuer; returns are price-only (dividends excluded) to 2026-11-17; worst drop is the largest peak-to-trough fall since the first price in our data, so funds with longer histories include 2008 or 2020; yield is approximate. Updated daily.
VFV, ZSP and XUS all track the S&P 500, so their returns are almost identical. Differences come down to a few hundredths of a percent in fees and how each fund holds its stocks (XUS, for example, holds a U.S.-listed iShares ETF, while ZSP owns the 500 stocks directly). XUU and VUN track the total U.S. market, which adds about 3,000 mid and small companies to the same large ones. Their returns have tracked the S&P 500 closely.
None of these funds is currency-hedged. When the Canadian dollar falls, your U.S. holdings are worth more in CAD, and the opposite when it rises. Over long periods this has added diversification rather than risk for Canadian investors. Hedged versions exist (for example XSP and ZUE), but they cost more and have lagged when the loonie weakened.
If you are deciding between VFV and its U.S.-listed twin, see VFV vs VOO for Canadians.
3. Best Canadian stock ETFs
| ETF | Fund | MER | 5-yr / yr | Worst drop | Yield |
|---|---|---|---|---|---|
| VCNVanguard FTSE Canada All Cap Index ETF | Vanguard FTSE Canada All Cap Index ETF | 0.05% | 10.4% | -37.3% (since 2013) | ~2.9% |
| XICiShares Core S&P/TSX Capped Composite Index ETF | iShares Core S&P/TSX Capped Composite Index ETF | 0.06% | 10.4% | -49.5% (since 2001) | ~2.9% |
| ZCNBMO S&P/TSX Capped Composite Index ETF | BMO S&P/TSX Capped Composite Index ETF | 0.06% | 10.2% | -37.2% (since 2009) | ~2.9% |
| XIUiShares S&P/TSX 60 Index ETF | iShares S&P/TSX 60 Index ETF | 0.17% | 10.1% | -49.0% (since 2006) | ~3.0% |
Live data: MER from the issuer; returns are price-only (dividends excluded) to 2026-11-17; worst drop is the largest peak-to-trough fall since the first price in our data, so funds with longer histories include 2008 or 2020; yield is approximate. Updated daily.
VCN, XIC and ZCN each own around 200 Canadian companies and charge about 0.05–0.06%, among the lowest fees on the TSX. XIU holds only the 60 largest companies and charges more; its main advantage is very high trading volume, which matters to traders and institutions more than to monthly savers.
The Canadian market is heavy in banks, energy and materials, and light in technology and health care. That is why most portfolios pair a Canadian ETF with U.S. and international funds instead of holding Canada alone. Canadian dividends do get favourable tax treatment in a non-registered account through the dividend tax credit.
4. Best dividend ETFs in Canada
| ETF | Fund | MER | 5-yr / yr | Worst drop | Yield |
|---|---|---|---|---|---|
| VDYVanguard FTSE Canadian High Dividend Yield Index ETF | Vanguard FTSE Canadian High Dividend Yield Index ETF | 0.22% | 12.6% | -39.5% (since 2012) | ~4.6% |
| XEIiShares S&P/TSX Composite High Dividend Index ETF | iShares S&P/TSX Composite High Dividend Index ETF | 0.22% | 9.8% | -47.4% (since 2011) | ~5.2% |
| CDZiShares S&P/TSX Canadian Dividend Aristocrats Index ETF | iShares S&P/TSX Canadian Dividend Aristocrats Index ETF | 0.66% | 7.5% | -52.7% (since 2006) | ~3.5% |
| ZEBBMO Equal Weight Banks Index ETF | BMO Equal Weight Banks Index ETF | 0.28% | 13.9% | -40.7% (since 2009) | ~4.5% |
Live data: MER from the issuer; returns are price-only (dividends excluded) to 2026-11-17; worst drop is the largest peak-to-trough fall since the first price in our data, so funds with longer histories include 2008 or 2020; yield is approximate. Updated daily.
Dividend ETFs pay out more cash than the broad market, which suits people who want income they can spend. The trade-off is concentration: VDY holds about 60 stocks and is dominated by banks, XEI leans more on energy and utilities, CDZ picks companies with long records of raising dividends but charges about 0.66%, and ZEB is simply the six big banks in equal weights.
A higher yield is not a higher return: the dividend comes out of the share price, so what matters is price change plus payouts. Dividend ETFs have led when banks and energy were strong, as in the last few years, and lagged when those sectors struggled. Use dividend ETFs if you need the cash flow, not as a shortcut to better performance. Our guide to the best dividend ETFs for a TFSA covers income portfolios in more depth, and the dividend calculator shows the monthly income for any amount.
5. Best international ETFs
| ETF | Fund | MER | 5-yr / yr | Worst drop | Yield |
|---|---|---|---|---|---|
| XEFiShares Core MSCI EAFE IMI Index ETF | iShares Core MSCI EAFE IMI Index ETF | 0.22% | 7.2% | -28.5% (since 2013) | ~2.7% |
| VIUVanguard FTSE Developed All Cap ex North America Index ETF | Vanguard FTSE Developed All Cap ex North America Index ETF | 0.21% | 7.7% | -29.8% (since 2015) | ~2.8% |
| XAWiShares Core MSCI All Country World ex Canada Index ETF | iShares Core MSCI All Country World ex Canada Index ETF | 0.22% | 9.6% | -27.3% (since 2015) | ~1.8% |
Live data: MER from the issuer; returns are price-only (dividends excluded) to 2026-11-17; worst drop is the largest peak-to-trough fall since the first price in our data, so funds with longer histories include 2008 or 2020; yield is approximate. Updated daily.
XEF and VIU cover developed markets outside North America: Europe, Japan, the U.K. and Australia. Add an emerging-markets fund (such as XEC or VEE) if you want China, India and Taiwan too. XAW combines the U.S., developed and emerging markets in one fund, everything except Canada, which makes it a natural partner for a Canadian ETF in a two-fund portfolio.
International stocks have trailed U.S. stocks for most of the last fifteen years. That is exactly the kind of streak that does not last forever, and it is why diversified portfolios keep them.
6. Best bond ETFs in Canada
| ETF | Fund | MER | 5-yr / yr | Worst drop | Yield |
|---|---|---|---|---|---|
| ZAGBMO Aggregate Bond Index ETF | BMO Aggregate Bond Index ETF | 0.09% | -2.7% | -25.4% (since 2010) | ~3.1% |
| VABVanguard Canadian Aggregate Bond Index ETF | Vanguard Canadian Aggregate Bond Index ETF | 0.08% | -2.5% | -24.0% (since 2011) | ~3.1% |
| XBBiShares Core Canadian Universe Bond Index ETF | iShares Core Canadian Universe Bond Index ETF | 0.1% | -2.4% | -24.2% (since 2006) | ~3.1% |
Live data: MER from the issuer; returns are price-only (dividends excluded) to 2026-11-17; worst drop is the largest peak-to-trough fall since the first price in our data, so funds with longer histories include 2008 or 2020; yield is approximate. Updated daily.
ZAG, VAB and XBB each own well over 1,000 Canadian government and corporate bonds and charge under 0.1%. They are practically interchangeable. Their job is not to grow but to fall less, or rise, when stocks drop, and to give you something to rebalance from. The 2022 rate shock was a reminder that bond funds can lose money too, but far less than stocks over most crashes. The details are in XBB vs VAB vs ZAG.
7. Tech and growth ETFs: useful, but not a core
| ETF | Fund | MER | 5-yr / yr | Worst drop | Yield |
|---|---|---|---|---|---|
| XQQiShares NASDAQ 100 Index ETF (CAD-Hedged) | iShares NASDAQ 100 Index ETF (CAD-Hedged) | 0.39% | 9.0% | -36.5% (since 2011) | ~0.5% |
| ZQQBMO NASDAQ 100 Equity Hedged to CAD Index ETF | BMO NASDAQ 100 Equity Hedged to CAD Index ETF | 0.39% | 8.9% | -36.8% (since 2011) | ~0.5% |
| QQQInvesco QQQ Trust | Invesco QQQ Trust | 0.18% | 10.6% | -83.0% (since 1999) | ~0.8% |
Live data: MER from the issuer; returns are price-only (dividends excluded) to 2026-11-17; worst drop is the largest peak-to-trough fall since the first price in our data, so funds with longer histories include 2008 or 2020; yield is approximate. Updated daily.
Nasdaq-100 funds have had a spectacular run, which is why they show up in every "best ETF" list. They are also concentrated: the ten largest holdings make up roughly half the fund, almost all of them in technology. XQQ and ZQQ are hedged to the Canadian dollar and cost about 0.39%. If you want them, keep them to a slice of the portfolio, for example 10–20%, next to a broad fund. The SPY vs QQQ comparison shows how much bigger the swings have been.
8. U.S.-listed ETFs: when they make sense for Canadians
| ETF | Fund | MER | 5-yr / yr | Worst drop | Yield |
|---|---|---|---|---|---|
| VOOVanguard S&P 500 ETF | Vanguard S&P 500 ETF | 0.03% | 9.4% | -34.3% (since 2010) | ~1.9% |
| VTIVanguard Total Stock Market ETF | Vanguard Total Stock Market ETF | 0.03% | 8.3% | -56.7% (since 2001) | ~1.8% |
| VTVanguard Total World Stock ETF | Vanguard Total World Stock ETF | 0.06% | 6.8% | -50.6% (since 2008) | ~2.1% |
| SCHDSchwab U.S. Dividend Equity ETF | Schwab U.S. Dividend Equity ETF | 0.06% | 6.1% | -33.4% (since 2011) | ~3.3% |
Live data: MER from the issuer; returns are price-only (dividends excluded) to 2026-11-17; worst drop is the largest peak-to-trough fall since the first price in our data, so funds with longer histories include 2008 or 2020; yield is approximate. Updated daily.
VOO, VTI and VT are cheaper than their Canadian cousins, at 0.03–0.06% a year, but you buy them in U.S. dollars. They make most sense in an RRSP: the Canada–U.S. tax treaty exempts U.S.-listed funds held in an RRSP from the 15% U.S. withholding tax on dividends. In a TFSA or FHSA, that 15% is lost whichever version you hold, so the Canadian-listed ETF is usually simpler.
Converting dollars at a typical bank or brokerage rate can cost 1–2% each way, which wipes out years of fee savings. If you go this route, use Norbert's gambit or a brokerage with low conversion costs, and keep enough U.S. dollars invested to justify the effort. In a non-registered account, U.S.-listed holdings over $100,000 in total cost also mean filing form T1135.
Putting it together: three simple ETF portfolios
| Portfolio | Holdings | Who it suits |
|---|---|---|
| One-fund | 100% XEQT or VEQT (or VGRO/XGRO with bonds) | Anyone who wants to automate and never rebalance |
| Two-fund | About 25% VCN + 75% XAW | People who want to choose their own Canadian weight |
| Four-fund | VCN + XUU + XEF + ZAG in your chosen mix | Hands-on investors who will rebalance once a year |
The extra control of a multi-fund portfolio saves only a few hundredths of a percent in fees and adds the job of rebalancing. Many investors who start with four funds end up switching to one. You can test any of these mixes over past crashes with the investment simulator before you commit.
What history says about holding ETFs for the long term
Broad stock ETFs have had positive returns over most 10-year periods, but the path is never smooth. Look at the "Worst drop" column in the tables: even the most diversified funds have fallen 20–50% at some point in our data, depending on whether their history includes 2008. Three things have mattered far more than which of two similar ETFs you picked:
- Staying invested. Missing a handful of the best days, which usually come right after the worst ones, cuts long-run returns sharply.
- Contributing regularly. Buying the same dollar amount each month means you buy more units when prices are low. See ETFs for monthly contributions.
- Keeping costs low. On $100,000, the gap between a 0.2% ETF and a 2% mutual fund is about $1,800 a year, and it compounds. Our guide to fees works through an example.
Which account should hold your ETFs?
The account often matters more than the ETF. In 2026 you can contribute $7,000 to a TFSA (with a cumulative limit of $109,000 for someone eligible since 2009; estimate yours with the TFSA calculator), up to 18% of last year's earned income to an RRSP, and $8,000 a year to an FHSA if you are saving for a first home.
- TFSA: growth and withdrawals are tax-free. Canadian-listed all-in-one or index ETFs are the simplest fit.
- RRSP: contributions are deductible and growth is tax-deferred. The best place for U.S.-listed ETFs and for bonds.
- FHSA: deductible in and tax-free out for a first home. Match the ETF to your timeline: more bonds if you plan to buy within three years.
- Non-registered: favour Canadian dividends and tax-efficient index funds, and avoid frequent switching that triggers capital gains.
For the order in which to fund them, read TFSA vs RRSP vs FHSA.
Mistakes to avoid
- Owning overlapping funds. XEQT plus VFV plus XIC mostly buys the same companies three times. Check the "What it holds" section on each ETF page.
- Chasing last year's winner. Switching from a broad fund into whatever led last year has historically cost returns.
- Switching for a 0.02% fee difference. In a non-registered account, selling can trigger a capital gain that costs far more than the fee saved.
- Ignoring currency conversion costs when buying U.S.-listed ETFs.
- Holding too much cash waiting for a better entry point. Time in the market has mattered more than timing.
Frequently asked questions
What is the best ETF in Canada for beginners?
An all-in-one ETF such as XEQT, VEQT or ZEQT for an all-stock portfolio, or VGRO/XGRO if you want about 20% in bonds. One purchase gives you thousands of companies worldwide, and the fund rebalances itself.
Is XEQT or VEQT better?
Neither is clearly better. They hold similar global portfolios at almost the same fee. VEQT holds a bit more in Canada, XEQT a bit more in international and emerging markets. Pick one and keep buying it.
What is the best ETF for a TFSA?
For long-term growth, a Canadian-listed all-in-one equity ETF or an S&P 500 ETF like VFV. Avoid U.S.-listed dividend ETFs in a TFSA, because the 15% U.S. withholding tax cannot be recovered there.
What is the cheapest ETF in Canada?
Among broad index ETFs, Canadian equity funds such as VCN, XIC and ZCN charge about 0.05–0.06% a year. S&P 500 funds VFV, ZSP and XUS charge under 0.1%, and bond funds ZAG, VAB and XBB about 0.08–0.10%.
Should I buy currency-hedged ETFs?
For long-term stock holdings, usually not. Hedging costs extra and removes the cushion that a falling Canadian dollar gives during global sell-offs. It can make sense for short-term money or bond holdings in foreign currencies.
How many ETFs should I own?
One all-in-one ETF is enough for most people. Two to four index ETFs give more control. Beyond that you are mostly adding overlap and rebalancing work.
Sources and method
Fees, holdings and regional breakdowns come from the issuers' own pages and fact sheets (Vanguard Canada, iShares by BlackRock Canada, BMO Global Asset Management, Vanguard U.S., State Street, Schwab and Invesco), each linked from the ETF's page on this site with its as-of date. Returns and worst drops are calculated by WhatIfInvested from split-adjusted daily closing prices, before dividends. Tax figures are the 2026 limits published by the Canada Revenue Agency. This guide is for education and is not personal investment advice.
Data for this guide
Price returns for the funds and stocks discussed above, updated daily. Distributions are not included.