Portfolio Drawdown Calculator: Measure Risk Before You Invest
A portfolio drawdown calculator helps you measure how far an investment strategy fell before it recovered. It turns risk into something visible: max drawdown, recovery time, downside pain, and whether the final return was worth the path.
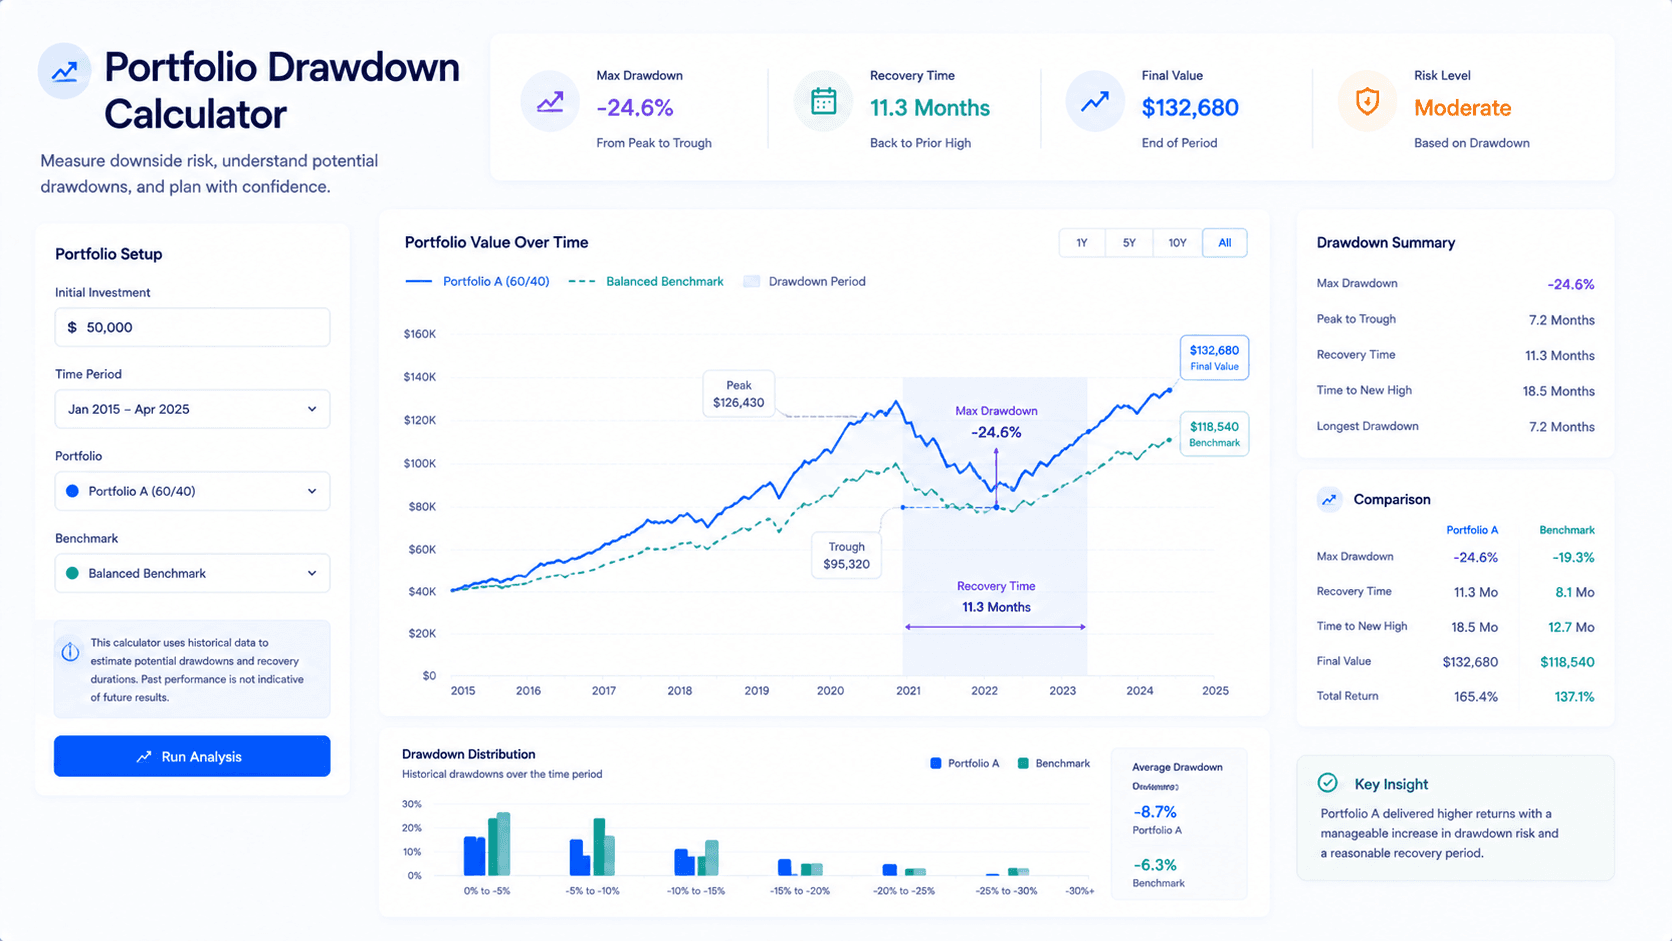
A portfolio drawdown calculator makes risk visible
A portfolio drawdown calculator answers a question that final value cannot answer: how painful was the journey? Two portfolios can finish with similar ending values, but one may have lost 18 percent at its worst point while the other lost 48 percent and took years to recover.
That difference matters because investors do not experience returns as a spreadsheet. They experience monthly account balances, headlines, fear, regret, cash needs, and the temptation to stop. A strategy that looks strong at the end may still be difficult to hold through the middle.
- Final value tells you where the strategy ended.
- Max drawdown tells you how far it fell along the way.
- Recovery time tells you how long patience was required.
- Benchmark drawdown tells you whether the risk was better or worse than a reference.
- Premium planning becomes useful when several scenarios must be saved and compared.
For WhatIfInvested, drawdown belongs inside the broader Simulate, Compare, Understand workflow. First you simulate a historical path. Then you compare final value, ROI, drawdown and recovery. Then you understand whether the strategy was actually investable for your goals and risk tolerance.
What drawdown means in a portfolio
Drawdown is the decline from a portfolio's previous high to a later low. If a portfolio grows from $100,000 to $140,000, then falls to $105,000 before recovering, the drawdown from peak to trough is 25 percent. A portfolio drawdown calculator helps identify that decline automatically instead of forcing you to inspect a chart by eye.
The most common version is max drawdown. Max drawdown is the largest peak-to-trough decline during the tested period. It is one of the simplest ways to understand downside risk because it focuses on what an investor actually sees in the account: the distance between the highest point and the deepest later fall.
Drawdown is not the same as volatility. Volatility measures how much returns fluctuate. Drawdown measures how bad the decline became before the portfolio recovered. A high-volatility strategy may not always have the worst drawdown, and a low-volatility strategy can still disappoint if it declines at the wrong time or recovers slowly.
This is why drawdown is so useful for backtesting. A backtest that only reports the ending value can make almost any successful long-term asset look easy. A drawdown view shows whether the investor had to survive a 20 percent decline, a 40 percent decline, or a multi-year recovery period before the final value appeared.
How the drawdown calculation works
The math behind a portfolio drawdown calculator is simple, but the interpretation is powerful. The calculator tracks the portfolio value through time. Each time the portfolio reaches a new high, that value becomes the new peak. If the portfolio later falls below that peak, the calculator measures the percentage decline from the peak to the current value.
The drawdown formula is:
If the previous peak was $200,000 and the portfolio later fell to $150,000, the drawdown was -25 percent. The portfolio lost one quarter of its value from the previous high before any later recovery.
Max drawdown is the worst of those declines during the full period. A portfolio might have several small drawdowns, one medium drawdown and one major drawdown. The max drawdown calculator result focuses on the deepest one because that is often the moment when investors are most likely to doubt the plan.
| Portfolio date | Portfolio value | Previous peak | Drawdown | Meaning |
|---|---|---|---|---|
| January | $100,000 | $100,000 | 0% | The portfolio is at a new high. |
| March | $112,000 | $112,000 | 0% | A new peak is established. |
| June | $94,000 | $112,000 | -16.1% | The portfolio is below the previous high. |
| September | $82,000 | $112,000 | -26.8% | This becomes the current max drawdown. |
| December | $115,000 | $115,000 | 0% | The strategy recovered and reached a new high. |
This is why recovery time belongs next to max drawdown. The decline tells you how deep the loss became. The recovery tells you how long the investor had to wait before the old peak returned. A short recovery may feel like normal volatility. A long recovery can change the entire investment experience.
For example, an investor who is 25 years from retirement may be able to treat a two-year recovery as part of the long-term process. An investor who planned to withdraw money next year may not have that flexibility. The same drawdown percentage can be acceptable in one context and dangerous in another.
A strong portfolio drawdown calculator should therefore avoid treating risk as a single number. It should connect the number to time, purpose and behavior. It should show the fall, the recovery and the comparison with the benchmark. It should also help the investor ask what would have happened if contributions continued during the decline.
That last question is important because many long-term investors do not invest once and stop. They add money monthly or quarterly. During a drawdown, new contributions may buy at lower prices. That can improve the later recovery, but only if the investor keeps contributing. A drawdown calculator that supports DCA gives a more realistic view for people who build portfolios from income.
The practical output is not simply "this strategy lost 27 percent." A better output is: "this strategy fell 27 percent from its prior high, recovered in nine months, stayed below the benchmark for part of the period, and required continued contributions to reach the final value." That sentence is much closer to a real decision.
The 7 risk signals a drawdown workflow should show
A useful portfolio drawdown calculator should do more than display one percentage. The percentage matters, but the decision comes from context. A 30 percent drawdown in a high-growth strategy may be expected. A 30 percent drawdown in a supposedly defensive income strategy may be a warning sign.
The calculator should help connect drawdown with time, contributions, benchmark behavior, and portfolio concentration. That is what turns a historical simulation into a decision tool.
The largest decline from a previous high. This is the headline downside risk number.
The time required to climb back to the previous high after the worst decline.
The moment when the strategy reached its deepest loss. This helps connect risk to market history.
Whether the portfolio fell more or less than SPY, QQQ, Bitcoin, a balanced ETF, or another reference.
Whether DCA softened the decline, added during the fall, or changed recovery behavior.
A deep drawdown may be tolerable if the recovery and long-term result justify the discomfort.
The practical question: would this path fit the investor's time horizon, cash needs and behavior?
The best output is not a number. It is a clear explanation of what the drawdown means.
FINRA explains that investment risk includes uncertainty that can negatively affect financial welfare, and that investors should consider whether they can ride out market ups and downs over time. That is the practical reason drawdown belongs inside any serious portfolio risk workflow. You can read FINRA's investor education overview on investment risk.
How to use a portfolio drawdown calculator
The best way to use a portfolio drawdown calculator is to start with a simple historical scenario. Choose the asset or portfolio, define the start date, define the end date, and decide whether the scenario uses lump sum, DCA, or both. Then review the path before reviewing the final value.
This order matters. Many investors naturally look at the largest number first. They see the ending value, the total gain, or the ROI. But a decision-quality simulation should ask a different question first: what did the investor have to endure to get that result?
Run the strategy over real historical market data.
Identify the worst peak-to-trough decline.
Measure how long the portfolio took to regain its old high.
Test the same period against another strategy or benchmark.
Step 1: define the strategy
Start with the asset mix. A single asset such as SPY, QQQ, Bitcoin, VFV or VEQT is easy to test. A portfolio adds more context because it shows how diversification changes the drawdown. If you only test one asset, you learn about that asset. If you test a portfolio, you learn about the combined path.
Step 2: choose the contribution style
A lump-sum test answers what would have happened if all money entered at the start. A DCA test answers what would have happened if money entered gradually. A portfolio drawdown calculator should let you compare both because the path can change even when the ending value looks similar.
Step 3: compare the decline with the recovery
A 35 percent drawdown that recovers in nine months is different from a 35 percent drawdown that needs five years to recover. The first may be emotionally difficult but manageable for a long-term investor. The second may interrupt goals, withdrawals, confidence, and the ability to keep contributing.
Step 4: compare against a benchmark
If a portfolio earned more than SPY but also had twice the drawdown, the outperformance may not be as attractive as it first appears. If a portfolio earned slightly less but had much lower drawdown, it may be more suitable for a specific investor. This is why the article on portfolio benchmark vs SPY is a useful next read after this page.
Never judge a simulated strategy by final value alone. Use a portfolio drawdown calculator to compare final value, max drawdown, recovery time and benchmark behavior together.
Why final value alone can mislead investors
Imagine three strategies that all start with the same amount. At the end of the period, Strategy A finishes with the highest value. Strategy B finishes slightly lower. Strategy C finishes lower still. If final value is the only metric, Strategy A looks obvious.
Now add drawdown. Strategy A lost 52 percent at its worst point and took four years to recover. Strategy B lost 28 percent and recovered in fourteen months. Strategy C lost 16 percent and recovered in six months. Suddenly the decision is not only about the winner. It is about which path the investor could realistically hold.
| Scenario | Final value | Max drawdown | Recovery time | Decision meaning |
|---|---|---|---|---|
| Growth-heavy portfolio | $412,000 | -52% | 48 months | Highest final value, but the path required high tolerance for deep losses. |
| Broad ETF portfolio | $368,000 | -28% | 14 months | Lower final value, but a more balanced risk and recovery profile. |
| Defensive allocation | $301,000 | -16% | 6 months | Lower return, but less downside pressure during difficult markets. |
A portfolio drawdown calculator does not tell you which strategy is universally best. It tells you what each strategy demands from the investor. That is more useful than a generic ranking because the right strategy depends on time horizon, risk tolerance, income stability, liquidity needs, and the ability to keep investing when the chart looks bad.
This is also where investment scenario planning becomes important. A single test is a starting point. A real decision often needs several scenarios: aggressive, balanced, defensive, DCA, lump sum, with fees, without fees, with withdrawals, and against a benchmark.
Drawdown changes how you read a backtest
Backtesting is useful because it shows how a strategy behaved in real market history. But a backtest can still be misleading if it is reduced to one ending value. The ending value is the result. Drawdown is the experience.
A portfolio that looks excellent from 2010 to 2026 may hide several difficult periods. It may have fallen sharply during a crash, stayed flat for years, or recovered only because later market conditions were unusually strong. A portfolio drawdown calculator helps make those periods visible.
If you are new to this workflow, start with portfolio backtesting for beginners. That article explains how to think about historical tests without treating them as predictions. Then read are investment simulators accurate? to understand the limits of historical modeling before using this drawdown article to focus specifically on downside risk.
Drawdown is not a forecast
A past drawdown does not prove that the next drawdown will be the same size. Markets can produce worse outcomes than the historical window you tested. But past drawdowns are still useful because they show what actually happened under known stress periods. They can reveal whether the strategy has already required more patience than the investor expected.
Drawdown is not a guarantee of safety
A portfolio with a low historical drawdown can still be risky if the tested period was favorable. A strategy can also become riskier if the assets, fees, correlations or market regime change. The role of a portfolio drawdown calculator is not to certify safety. It is to improve the quality of the question.
Drawdown is a behavior test
The most valuable question is not only "what was the worst decline?" It is "would I have stayed invested during that decline?" A strategy that requires behavior you cannot maintain is not a good strategy for you, even if it looks mathematically attractive.
What investors get wrong about drawdown
The biggest mistake is treating drawdown as a side statistic. It is not a decorative metric. It is one of the clearest ways to understand whether a strategy was realistically investable during stress.
| Mistake | Why it hurts the decision | Better approach |
|---|---|---|
| Only checking final value | The highest ending value can hide a painful path. | Compare final value with max drawdown and recovery time. |
| Ignoring recovery time | A large drawdown is worse when it lasts for years. | Ask how long the portfolio stayed below its old high. |
| Comparing different periods | One strategy may look safer only because it was tested over an easier window. | Use the same start and end dates when comparing scenarios. |
| Ignoring contributions | DCA can change the path, the invested amount and the recovery profile. | Compare lump sum and DCA separately when contribution behavior matters. |
| Assuming past drawdown is the worst possible case | Future markets can be worse than the tested history. | Use drawdown as a stress lens, not a guarantee. |
Another mistake is forgetting that drawdown has a personal dimension. A 40 percent drawdown may be acceptable for a young investor with high income, no near-term withdrawal needs and a long time horizon. The same decline may be unacceptable for someone near retirement, using the portfolio for income, or relying on the money for a goal within a few years.
This is why drawdown analysis should connect to the broader plan. It belongs next to allocation, benchmark comparison, fees, contribution schedule and goal timing. If those assumptions change, the drawdown interpretation changes too.
How much drawdown is too much?
There is no universal answer. A portfolio drawdown calculator can show the number, but the investor has to decide whether the number is acceptable. The answer depends on the purpose of the money.
For long-term wealth building, a moderate drawdown may be tolerable if the investor has time, income and discipline. For near-term goals, even a smaller drawdown may be a problem. If money is needed soon, the ability to recover matters less than the risk of being forced to sell at a bad time.
Often easier to tolerate, but still meaningful if the money is needed soon.
Common in equity-heavy strategies, but behavior and recovery time become important.
Potentially difficult to hold. Requires strong conviction, time horizon and risk capacity.
These ranges are not recommendations. They are a way to frame the conversation. A defensive portfolio that falls 25 percent may be more concerning than a growth portfolio that falls 25 percent because the expectation was different. The same drawdown can mean different things depending on the strategy's purpose.
The best practice is to compare drawdown with the reason the portfolio exists. A retirement income portfolio, a house down payment fund, a long-term ETF accumulation plan and a speculative crypto allocation should not be judged by the same drawdown standard.
Before you trust a strategy, ask these questions
If it underperformed while also taking deeper drawdowns, the risk may not have been rewarded.
A long recovery may be acceptable for retirement in 30 years, but not for money needed in 24 months.
A DCA plan only works if the investor keeps investing when the chart looks uncomfortable.
A single asset can dominate both gains and drawdowns. Concentration risk changes the interpretation.
Costs and cash flows can make the path harder than the raw asset return suggests.
If the decision is important, keeping assumptions organized becomes part of the value.
If the answer to several of these questions is unclear, the strategy needs more testing. Use a portfolio drawdown calculator as the first risk lens, then compare the same strategy inside a broader scenario planning workflow.
Portfolio drawdown calculator FAQ
What is a portfolio drawdown calculator?
A portfolio drawdown calculator measures how far a portfolio fell from a previous high to a later low. It helps investors see max drawdown, downside risk and how difficult the path may have been before recovery.
What is max drawdown?
Max drawdown is the largest peak-to-trough decline during a tested period. If a portfolio reached $100,000, fell to $70,000 and later recovered, the max drawdown from that peak was 30 percent.
Why is drawdown important?
Drawdown is important because final value does not show the pain required to reach that result. A strategy with a strong ending value may still have required years of patience after a large decline.
Is drawdown the same as volatility?
No. Volatility measures how much returns fluctuate. Drawdown measures the decline from a previous high to a later low. Both help explain risk, but they answer different questions.
How do I calculate portfolio drawdown?
Find the portfolio's previous peak value, then compare it with the lowest later value before recovery. The drawdown percentage is the decline from peak to trough divided by the peak value.
What is a good maximum drawdown?
There is no universal good maximum drawdown. A drawdown that is acceptable for a long-term growth portfolio may be too high for short-term savings or retirement income. The right threshold depends on time horizon, cash needs and risk tolerance.
Can DCA reduce drawdown?
DCA can change the investor's experience because money enters gradually instead of all at once. It may reduce the impact of investing at a single bad entry point, but it does not remove market risk or guarantee lower drawdown.
Which WhatIfInvested tool should I use first?
Use the Investment Simulator first if you want to test a historical path. Use Premium when you need multiple portfolios, saved scenarios, benchmark comparison, risk summaries and exportable reports.
This article is for educational purposes only and is not financial advice. Historical performance does not guarantee future results. Investors should consider their own objectives, risk tolerance, time horizon, fees, taxes and local rules before making investment decisions.