Ethereum vs Nasdaq 100: A Surprising ROI Battle
Ethereum and the Nasdaq 100 both represent growth, innovation, and investor optimism. But they are not the same kind of bet. This guide compares raw return, volatility, drawdown risk, portfolio role, DCA behavior, and when each exposure can make sense.
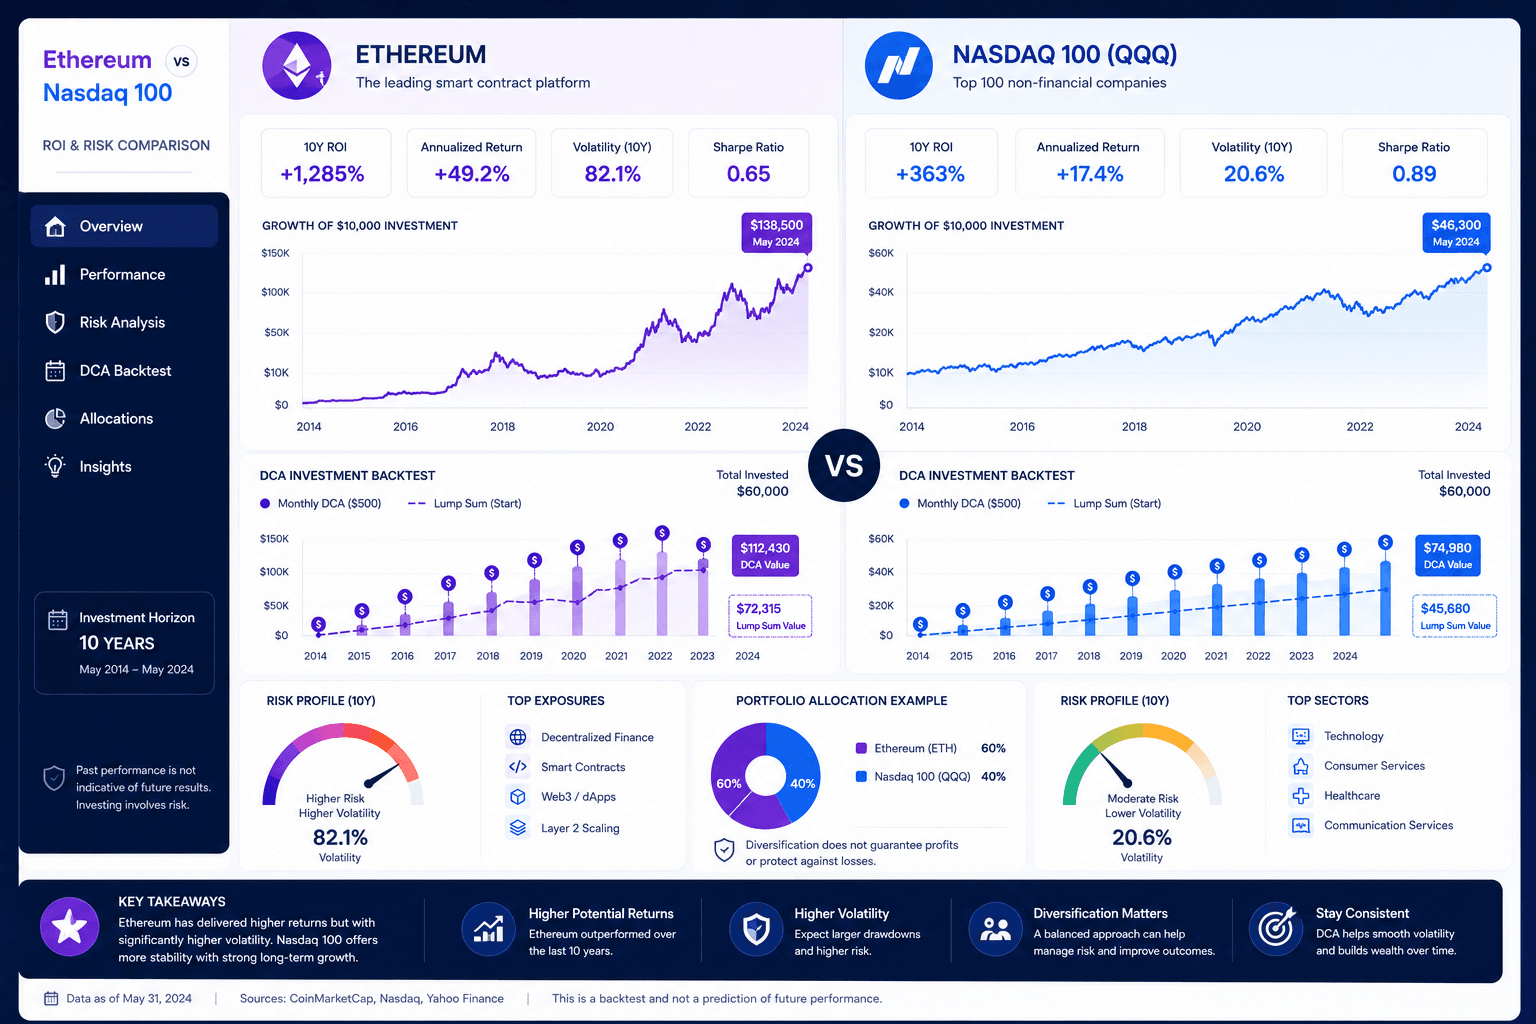
Quick View: ETH Had Explosive Upside, QQQ Had a Cleaner Investment Framework
Ethereum vs Nasdaq 100 is not simply a question of which asset went up more. Ethereum has delivered extraordinary historical upside during crypto adoption waves, but that upside came with extreme drawdowns, liquidity cycles, regulatory uncertainty, and technology-specific risk. The Nasdaq 100, often tracked through QQQ, offered concentrated exposure to large technology and growth companies with lower volatility than ETH, but still meaningful stock-market risk.
The better question is: which role are you asking the asset to play? ETH can behave like a high-conviction, high-volatility satellite position. QQQ can behave like a growth-heavy equity allocation. Both can compound wealth, but they require different expectations, position sizing, and emotional discipline.
ETH is a programmable blockchain asset tied to smart contracts, decentralized applications, staking, and crypto network adoption. It can move violently because valuation depends on adoption, speculation, liquidity, fees, regulation, and investor risk appetite.
The Nasdaq 100 is an equity index of major non-financial companies listed on Nasdaq, heavily tilted toward technology and growth. It has corporate earnings, index rules, fund structure, dividends, and a long institutional history.
Why Compare Ethereum and the Nasdaq 100?
At first glance, Ethereum and the Nasdaq 100 seem like very different investments. One is a crypto network asset. The other is an index of public companies. Yet many modern investors compare them because both sit in the “innovation growth” part of the imagination. ETH represents blockchain infrastructure and decentralized finance. QQQ represents large-cap technology platforms, cloud computing, software, semiconductors, and internet businesses.
The comparison is useful because it separates three ideas that often get mixed together: return potential, volatility, and confidence. ETH may offer larger upside in certain periods, but that upside can come with deeper losses and higher uncertainty. QQQ may offer less explosive upside, but it is easier for many investors to understand because the underlying holdings are public companies with revenues, earnings, and index disclosures.
Investors also compare Ethereum vs Nasdaq 100 because both can be used as alternatives to a plain broad-market fund. A traditional investor might ask whether QQQ is enough growth exposure. A crypto-curious investor might ask whether ETH deserves a place beside equity funds. A backtester might ask whether small ETH exposure improved total portfolio results or simply increased volatility.
The comparison becomes more useful when you avoid all-or-nothing framing. The choice is not always 100% ETH or 100% QQQ. Many portfolios may use broad equities as a core, QQQ as a growth tilt, and ETH as a smaller satellite allocation. The position size matters as much as the asset choice.
What Ethereum and the Nasdaq 100 Actually Represent
Ethereum is not a company. It is a blockchain network and ETH is the native asset used for transaction fees, staking, and economic activity within the ecosystem. Its value can be influenced by network demand, developer activity, token supply dynamics, crypto liquidity, staking yields, regulatory developments, and competing chains.
The Nasdaq 100 is not a single technology stock. It is an index that contains many large non-financial companies listed on Nasdaq. In practice, investors often access it through the QQQ ETF or similar funds. Its performance is influenced by earnings growth, valuations, interest rates, concentration in mega-cap technology companies, and broader equity market conditions.
| Feature | Ethereum | Nasdaq 100 / QQQ |
|---|---|---|
| Asset type | Crypto network asset | Equity index / ETF exposure |
| Return driver | Adoption, network usage, liquidity, speculation, staking economics | Corporate earnings, valuation multiples, tech sector growth |
| Risk profile | Very high volatility, regulatory uncertainty, protocol/ecosystem risk | Equity volatility, valuation risk, sector concentration |
| Investor role | Satellite/high-risk growth allocation | Growth equity allocation |
| Common vehicle | ETH spot holdings or crypto products where available | QQQ or Nasdaq 100 tracking funds |
This distinction matters for portfolio construction. ETH can rise or fall for reasons that have little to do with public-company earnings. QQQ can fall even when technology remains important because valuations, rates, and earnings expectations change. Both are growth-oriented, but they are not interchangeable.
Trusted References Behind This Comparison
For neutral context, Ethereum.org explains what Ethereum is, Nasdaq publishes the official Nasdaq-100 Index factsheet, and Invesco provides details on QQQ as a Nasdaq-100 ETF. These sources help separate the asset definitions from the WhatIfInvested simulation workflow.
The goal is not to rely on one perfect historical chart. The goal is to compare Ethereum vs Nasdaq 100 using clear asset definitions, transparent index context, and a repeatable backtesting process.
Methodology: How to Compare ETH vs QQQ Fairly
A fair Ethereum vs Nasdaq 100 comparison must define the start date, end date, contribution method, data source, fees, and whether the test uses lump sum or DCA. Crypto markets trade continuously. ETFs trade during market hours. That difference alone can create small timing mismatches if the backtest is not careful.
Another issue is data availability. QQQ has a long public trading history. Ethereum’s live trading history starts much later. This means a full multi-decade comparison is not possible without using assumptions or proxies. A cleaner approach is to compare the period where both assets have usable data, then separately discuss what that period does and does not prove.
The most important metrics are not just final value. A good comparison should include total invested, ending value, gain, ROI, maximum drawdown, worst year, best year, volatility, and recovery behavior. If one asset ends higher but falls 80% along the way, the investor experience is very different from a smoother path.
- Lump sum test: shows what happened if all capital was invested at the start.
- DCA test: shows how recurring monthly contributions behaved across volatility.
- Hybrid test: shows a blend of immediate exposure and ongoing contributions.
- Portfolio test: shows whether a smaller ETH allocation improved or damaged a diversified portfolio.
For transparency, the WhatIfInvested methodology page explains how assumptions affect historical simulation outputs. If you want to test your own dates and contribution amounts, use the Investment Simulator.
Ethereum vs Nasdaq 100 ROI: The Raw Return Battle
Raw ROI is where Ethereum often captures attention. During major crypto bull markets, ETH has delivered the kind of returns that traditional equity investors rarely see. Early investors who held through multiple cycles could have seen extraordinary gains. That is the core reason ETH appears in so many “what if you invested” comparisons.
However, raw ROI can be misleading when shown alone. It often starts from a very low base, ignores the psychological cost of volatility, and may assume perfect holding behavior. Many investors who bought early did not hold through every drawdown. Some sold after large gains. Some bought near cycle peaks. Some lost access to wallets. Some overallocated and could not tolerate the decline.
QQQ’s raw return profile is less dramatic, but it is still powerful. The Nasdaq 100 benefited from the long rise of mega-cap technology, cloud computing, software, semiconductors, digital advertising, and platform businesses. Investors who held through corrections were rewarded, but the path was more tied to earnings and public-company fundamentals than crypto network cycles.
| Comparison angle | Ethereum advantage | Nasdaq 100 advantage |
|---|---|---|
| Explosive upside | Historically much larger during crypto adoption waves. | Usually lower upside, but still strong during tech bull markets. |
| Understandability | Requires comfort with blockchain economics and crypto market structure. | Backed by public companies, earnings, and index methodology. |
| Behavioral difficulty | Very high due to extreme drawdowns and cycle narratives. | Moderate to high, especially during tech selloffs and rate shocks. |
| Portfolio fit | Often better as a smaller satellite position. | Can function as a growth equity sleeve. |
The raw return winner in a historical window may be ETH, but the investment-quality answer depends on whether the investor could actually hold the position, size it properly, and avoid buying only after euphoric rallies.
Risk and Volatility: The Part ROI Screenshots Hide
Ethereum’s volatility is not a minor detail. It is central to the investment. ETH can experience drawdowns that would be unacceptable for many traditional investors. A position that can fall 60%, 70%, or more requires disciplined sizing. If a position is too large, volatility stops being an opportunity and becomes a forced decision.
The Nasdaq 100 also carries risk. QQQ can fall sharply when technology valuations compress, interest rates rise, or mega-cap earnings disappoint. It is not a risk-free innovation fund. It is concentrated compared with a broad global index and can underperform when market leadership rotates away from growth stocks.
The difference is scale and source. ETH’s risk is linked to crypto cycles, regulation, security perception, network economics, and liquidity. QQQ’s risk is linked to equity markets, business fundamentals, valuation, and sector concentration. Both can decline, but the reason for decline may be different.
Cycle severity
Crypto cycles can be fast, emotional, and extreme. The investor must survive the path, not just admire the ending value.
Growth concentration
Nasdaq 100 exposure depends heavily on large technology and growth companies. It can lag when valuations compress.
Overconfidence
Both assets can tempt investors to extrapolate recent returns. Buying after a huge run can be very different from buying before one.
A strong investor does not ask only which asset has the highest upside. They ask how much downside they can tolerate without selling. That answer often determines position size.
DCA Into ETH vs QQQ: A More Realistic Investor Test
Many investors do not deploy a large lump sum at the exact start of a backtest. They invest monthly from income. That is why a DCA comparison can be more realistic than a single lump sum chart. It shows how recurring contributions interacted with volatility.
For Ethereum, DCA can be psychologically helpful because it spreads entries across violent cycles. Buying a fixed amount monthly means the investor buys more ETH when prices are lower and less when prices are higher. This can reduce regret compared with trying to time the crypto bottom. However, DCA does not remove asset risk. If ETH enters a prolonged bear market, the investor still faces losses.
For QQQ, DCA can also work well because the Nasdaq 100 has experienced corrections, bear markets, and periods of valuation stress. Monthly contributions can help investors avoid placing all capital at a temporary peak. The smoother structure of an ETF can also be easier for beginners to follow.
The key difference is emotional intensity. DCA into QQQ may feel uncomfortable during bear markets. DCA into ETH can feel existential during crypto winters. That difference should affect position size and expectations.
| DCA factor | ETH | QQQ |
|---|---|---|
| Benefit of volatility | Can accumulate more units during deep crypto drawdowns. | Can smooth entries during tech corrections. |
| Behavioral challenge | Very high because declines can be extreme and narratives change fast. | Moderate because declines are tied to familiar equity cycles. |
| Best use | Smaller satellite DCA for investors who understand crypto risk. | Growth equity DCA for investors comfortable with tech concentration. |
If you want to model monthly contributions, use the DCA Calculator. For deeper comparisons involving weighted portfolios, fees, benchmarks, rebalancing, and saved scenarios, use the Premium DCA Calculator.
Portfolio Role: Should ETH Replace QQQ?
For most investors, Ethereum should not be treated as a direct replacement for a Nasdaq 100 allocation. The assets do different jobs. QQQ is a growth equity fund. ETH is a crypto network asset. Replacing one with the other changes the portfolio’s risk profile, not just its return potential.
A more practical question is whether ETH belongs as a small satellite allocation next to equity funds. For example, an investor might hold a broad-market core, a QQQ growth tilt, and a small ETH allocation. This structure acknowledges ETH’s upside without allowing it to dominate the entire plan.
Position sizing is the main control. A 2% ETH allocation and a 40% ETH allocation are not the same decision. The smaller allocation may add upside optionality while limiting damage if the thesis fails. The larger allocation can dominate the portfolio and turn crypto volatility into household-level stress.
0-2% ETH
Mostly traditional portfolio, with crypto treated as a small optional exposure.
3-7% ETH
Meaningful satellite allocation that can affect results without fully controlling the portfolio.
10%+ ETH
High conviction allocation where crypto volatility can dominate the investor experience.
This is where backtesting helps. Instead of debating ETH vs QQQ in isolation, test portfolios such as 90% QQQ / 10% ETH, 80% broad market / 10% QQQ / 10% ETH, or other mixes that match your risk tolerance.
Common Mistakes in Ethereum vs Nasdaq Comparisons
The first mistake is using the best possible ETH entry point and comparing it with an ordinary QQQ entry point. That creates a hindsight-biased comparison. A fair test should use consistent dates or explain why the dates differ.
The second mistake is ignoring survivability. It is easy to say that ETH produced higher returns if the investor held through every cycle. It is harder to explain how many investors would have stayed calm during deep drawdowns. A return that requires superhuman behavior may not be realistic for the average investor.
The third mistake is ignoring taxes, fees, custody, and implementation. ETF investing and crypto investing have different operational details. Crypto investors must think about exchanges, wallets, custody, staking, taxes, and security. ETF investors must think about fund fees, spreads, taxes, and concentration risk.
The fourth mistake is overgeneralizing from one period. ETH’s historical rise came from early adoption and a major expansion in crypto markets. QQQ’s historical performance came from a powerful era for large technology companies. Future returns may differ for both assets. The backtest is a learning tool, not a promise.
The fifth mistake is choosing based only on excitement. The more exciting asset is not always the better fit. A good portfolio is one the investor can hold, fund, rebalance, and understand.
How Interest Rates and Liquidity Affect ETH and QQQ
Both Ethereum and the Nasdaq 100 can be sensitive to liquidity, but they respond through different channels. Growth stocks often benefit when discount rates are low because future earnings become more valuable in present-value terms. When rates rise, valuations can compress, especially for companies priced for long-duration growth.
Crypto assets can also react strongly to liquidity conditions. When risk appetite is high and capital is abundant, speculative and high-growth assets can attract flows. When liquidity tightens, investors may reduce exposure to assets with uncertain cash flows or higher perceived risk. ETH can therefore move sharply during macro shifts even when the underlying technology continues developing.
This is why ETH vs Nasdaq 100 should not be studied only from a technology perspective. Macro conditions matter. Liquidity, rates, inflation expectations, and investor risk appetite can all influence both assets. The difference is that QQQ has corporate earnings as a valuation anchor, while ETH depends more heavily on network adoption, token economics, and market confidence.
Decision Framework: Which Exposure Fits Your Plan?
Use a decision framework instead of asking which asset is universally better. If your goal is familiar growth equity exposure, QQQ is easier to explain and easier to benchmark. If your goal is high-risk exposure to blockchain infrastructure, ETH may be more aligned. If your goal is stable core investing, neither should automatically replace a diversified broad-market fund.
| If you want... | ETH may fit when... | QQQ may fit when... |
|---|---|---|
| Maximum upside potential | You accept extreme volatility and small position sizing. | You want growth, but within public equity markets. |
| Better transparency | You understand on-chain data, custody, and crypto risks. | You prefer public companies, fund disclosures, and index rules. |
| Recurring monthly investing | You can keep buying through crypto winter without overallocating. | You want a simpler equity DCA habit. |
| Diversified portfolio fit | You use ETH as a satellite, not the whole portfolio. | You use QQQ as a growth tilt beside broader equity exposure. |
A good answer may include both assets in different sizes. It may also include neither if the investor does not understand the risk. The best portfolio is not the one with the most exciting backtest. It is the one that supports the investor’s real goals.
How a 5% ETH Allocation Can Change a QQQ-Heavy Portfolio
One of the most practical ways to compare Ethereum and the Nasdaq 100 is to stop treating them as mutually exclusive. A small ETH allocation beside a QQQ or broad-market equity allocation can have a large effect during crypto bull markets, but a limited effect during crypto crashes if the position is sized carefully.
This is the basic satellite principle. The core of the portfolio is designed to carry the long-term plan. The satellite is designed to add upside, diversification of return drivers, or exposure to a theme the investor understands. ETH may fit the satellite role for investors who believe in blockchain infrastructure but do not want crypto volatility to control the entire account.
For example, a portfolio with 95% traditional equity exposure and 5% ETH will not behave like a pure ETH portfolio. If ETH rises dramatically, the small allocation can still contribute meaningfully. If ETH falls sharply, the damage is contained relative to the total portfolio. That is very different from putting half of a long-term portfolio into crypto because a recent chart looked exciting.
QQQ can also be a satellite if the investor already owns a broad global stock index. In that case, QQQ adds a growth tilt. The investor is increasing exposure to technology-heavy companies, not replacing the entire portfolio. This distinction helps reduce overconcentration.
The best way to test this is not with a single ETH vs QQQ chart. It is with a portfolio mix. Try 100% QQQ, 95% QQQ / 5% ETH, 90% broad market / 10% QQQ, and 80% broad market / 10% QQQ / 10% ETH. Compare final value, drawdown, and the worst period. The result may show that a small allocation changes upside without making the plan impossible to hold.
Tax, Custody, and Implementation Differences
Investors often compare returns and forget implementation. QQQ exposure is usually obtained through an ETF or similar fund. The operational steps are familiar: buy shares through a brokerage, receive fund documents, track distributions, and report taxes according to the account type and jurisdiction.
Ethereum can require more decisions. An investor may hold ETH on an exchange, move it to a self-custody wallet, use a crypto ETF or fund where available, or participate in staking depending on local rules and personal knowledge. Each path has different risks. Exchange custody introduces platform risk. Self-custody introduces key-management risk. Staking introduces additional technical and tax considerations.
Taxes can also differ. Selling QQQ shares, selling ETH, receiving staking rewards, and holding assets in taxable or registered accounts may all have different consequences depending on where you live. A backtest that ignores taxes can still be useful for learning, but it should not be mistaken for an after-tax financial plan.
Fees matter too. QQQ has an expense ratio and market spreads. Crypto trading can involve spreads, exchange fees, network fees, and custody costs. During network congestion, crypto transaction costs can become more visible. These details are not exciting, but they affect the investor’s actual outcome.
This is another reason to avoid oversized conclusions. ETH may win a historical ROI screenshot, but implementation risk is part of the real investor experience. QQQ may be simpler to hold, but concentration and valuation risk remain. The better decision accounts for the whole process, not just the chart.
When Ethereum Can Make Sense
Ethereum can make sense for investors who understand crypto risk, believe in the long-term role of programmable blockchains, and can size the position so that large drawdowns do not damage the overall plan. It is not ideal for money needed soon, emergency reserves, or investors who will panic after a major decline.
ETH may also make sense for investors who want exposure to a different set of return drivers than public equities. Ethereum’s thesis is not identical to the Nasdaq 100. It depends on network usage, applications, token economics, developer activity, and broader crypto adoption. That difference can be useful, but it also increases uncertainty.
The strongest ETH investors are often those who predefine their position size, rebalance periodically, and avoid chasing euphoric moves. They treat ETH as a risky asset with upside, not a guaranteed path to wealth. They also understand that even a strong technology can be a bad investment if bought at an unsustainable price or sized irresponsibly.
When Nasdaq 100 Exposure Can Make Sense
Nasdaq 100 exposure can make sense for investors who want a growth tilt inside public equity markets. QQQ gives exposure to large companies with real businesses, audited financials, index methodology, and long trading history. That makes it easier to analyze than a crypto asset for many investors.
However, QQQ is not a total-market replacement for everyone. It is concentrated in large growth companies and can become expensive when technology enthusiasm is high. If the investor already owns a broad U.S. or global index, adding QQQ increases concentration in many companies they may already own indirectly.
QQQ may be most useful when the investor understands that it is a tilt, not a magic engine. It can outperform for long periods, but it can also underperform when market leadership changes. A disciplined investor should compare QQQ against broad indexes and decide whether the additional concentration is intentional.
How to Build a Personal ETH vs QQQ Test
To build a useful personal test, start with your actual contribution amount. A 100 dollar monthly contribution creates a different experience than a 2,000 dollar monthly contribution. Then choose the asset mix you are actually considering. Do not test unrealistic allocations just because they create dramatic charts.
Next, choose at least three time windows. Test a favorable crypto period, a difficult crypto period, and a mixed period. This reduces the risk of building a decision from one lucky start date. If a strategy only looks good in one carefully chosen window, it may be weaker than it appears.
Then examine both final value and the worst experience along the way. What was the maximum drawdown? How long did recovery take? Did the strategy require continuing contributions while the portfolio was deeply negative? Would you have followed it?
Finally, compare the result with a simpler alternative. If a complex ETH and QQQ mix only slightly improves return but dramatically increases stress, it may not be worth it. If a small ETH allocation meaningfully improves upside without destroying drawdown tolerance, it may deserve further study.
What This Comparison Does Not Predict
No Ethereum vs Nasdaq 100 article can tell you which asset will dominate the next decade. ETH could benefit from broader blockchain adoption, staking economics, tokenization, and application growth. It could also face regulatory pressure, competition, technical risks, or long periods where investor enthusiasm fades. QQQ could continue benefiting from technology earnings, artificial intelligence, cloud infrastructure, and platform businesses. It could also struggle if valuations compress, rates stay high, or market leadership shifts.
The point of this article is not to crown a permanent winner. It is to help you understand the type of risk you are accepting. ETH is usually the more asymmetric and volatile bet. QQQ is usually the more institutionally familiar growth equity exposure. A good investor can respect both without confusing them.
When you run your own simulation, treat it as a decision support tool. Change the dates, contribution amounts, allocation weights, and assumptions. If your conclusion only works under one perfect historical window, be careful. If the plan still makes sense across several different market environments, it may be more durable.
Test ETH vs Nasdaq 100 With Your Own Numbers
The most useful comparison is personal: your starting amount, monthly contribution, start date, end date, risk tolerance, and allocation. Use free tools for quick historical tests and Premium when you need multiple portfolios, fees, benchmarks, rebalancing, saved scenarios, exports, and decision-ready reports.
Related Guides for Crypto, ETFs, and Backtesting
Continue with these guides if you want more context before deciding how ETH, QQQ, or crypto exposure should fit into your portfolio.
Frequently Asked Questions
Is Ethereum better than the Nasdaq 100?
Ethereum has delivered stronger upside in some historical periods, but it also carries much higher volatility and crypto-specific risk. Nasdaq 100 exposure is usually easier to understand as a growth equity allocation. Better depends on your risk tolerance, time horizon, and position size.
Is QQQ safer than Ethereum?
QQQ is generally less volatile than ETH and is based on public-company equity exposure, but it is not risk-free. It can fall sharply during tech bear markets or valuation resets. ETH usually requires more conservative sizing because drawdowns can be extreme.
Can Ethereum and QQQ both be in the same portfolio?
Yes. Many investors treat QQQ as a growth equity tilt and ETH as a smaller satellite allocation. The key is to size ETH carefully so crypto volatility does not dominate the entire portfolio.
Is DCA better for ETH or QQQ?
DCA can help with both, but the benefit is especially behavioral for ETH because crypto volatility is high. Monthly contributions can reduce timing pressure, but they do not remove the need for risk control.
How can I simulate ETH vs Nasdaq 100?
You can use the WhatIfInvested Investment Simulator for quick historical tests. For deeper comparisons with weighted portfolios, fees, benchmarks, rebalancing, exports, and saved scenarios, use the Premium DCA Calculator.
Conclusion: ETH Can Win the ROI Battle Without Being the Right Core Holding
Ethereum vs Nasdaq 100 is a fascinating comparison because it highlights the difference between upside and usability. ETH has shown the kind of explosive historical return potential that can dominate a chart. QQQ has delivered strong growth within a more familiar equity structure. Both can be useful, but they are not the same tool.
If you only care about the highest historical upside, ETH may look like the obvious winner in certain periods. If you care about transparency, lower relative volatility, public-company fundamentals, and easier portfolio integration, QQQ may be more appropriate. If you care about building a real portfolio, the answer may involve both assets in different sizes.
The strongest approach is to test scenarios rather than chase headlines. Model lump sum, DCA, and mixed allocations. Measure drawdown, not just final value. Think about taxes, fees, custody, and behavior. Then choose the exposure you can actually hold through the next difficult cycle.