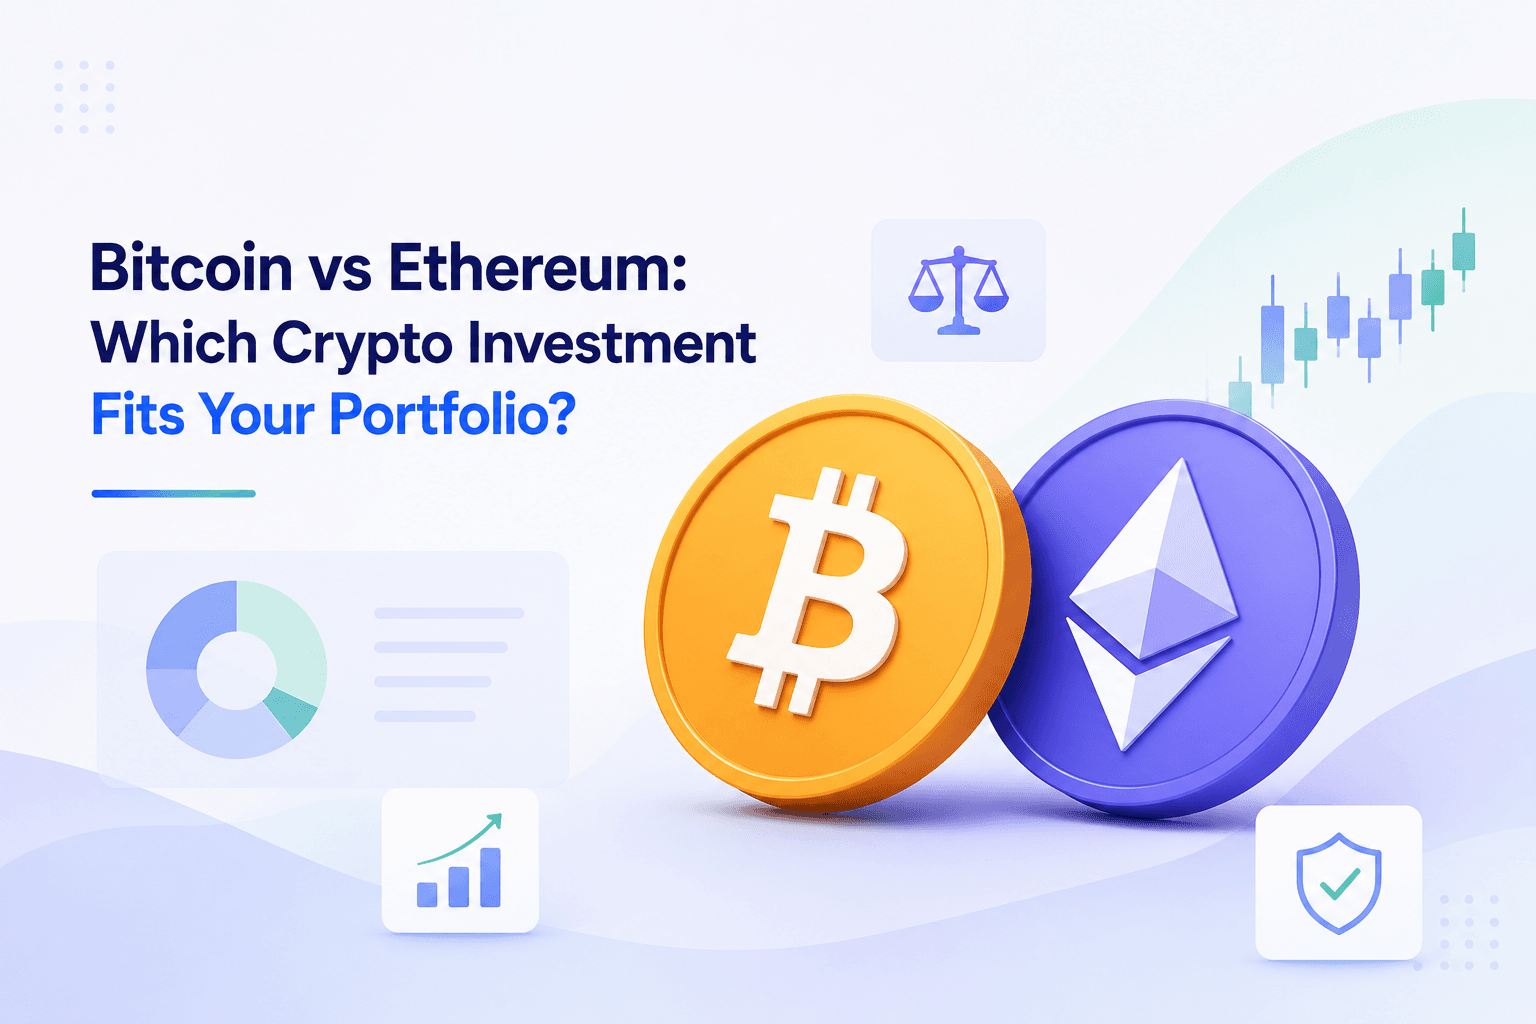
Bitcoin vs Ethereum: Which Crypto Investment Fits Your Portfolio?
Bitcoin and Ethereum are often compared as if they solve the same problem. They do not. Bitcoin is usually framed as scarce digital money. Ethereum is a programmable network for applications, tokens, smart contracts, and on-chain financial activity. This guide compares BTC and ETH by thesis, risk, adoption drivers, DCA behavior, portfolio role, and investor fit.
Quick answer: Bitcoin vs Ethereum
If you want the simplest answer, Bitcoin is usually the cleaner choice for investors who want a scarce, monetary crypto asset with a simple thesis. Ethereum is usually the stronger choice for investors who believe programmable blockchains, decentralized applications, tokenized assets, stablecoins, and smart contracts will continue to grow.
That means Bitcoin vs Ethereum is not only a return comparison. It is a thesis comparison. Bitcoin asks: can a fixed-supply digital asset become a long-term store of value and alternative monetary network? Ethereum asks: can a programmable blockchain become a settlement layer for digital applications, financial contracts, tokens, and decentralized infrastructure?
Choose BTC if you want simplicity
Bitcoin is easier to explain: limited supply, decentralized monetary asset, strong brand, long history, and a store-of-value narrative. Its investment case is less dependent on application activity.
Choose ETH if you want network utility
Ethereum is broader and more complex. Its investment case depends on network usage, smart contracts, developer activity, scaling, fees, staking, and long-term demand for blockspace.
Practical takeaway: many crypto investors use Bitcoin as the core crypto holding and Ethereum as a higher-utility growth layer. You can test historical contribution scenarios with the Investment Simulator or compare crypto to traditional assets in ETF vs Crypto: What the Data Says.
Trusted references for this comparison
This Bitcoin vs Ethereum guide separates the monetary thesis from the programmable-network thesis. For neutral background, Bitcoin.org explains how Bitcoin works, while Ethereum.org explains what Ethereum is and how smart contracts fit into the network.
These references help frame Bitcoin as a scarce digital monetary network and Ethereum as programmable blockchain infrastructure. The investment decision still depends on risk tolerance, time horizon, allocation size, custody practices, and whether the investor can hold through volatility.
Bitcoin vs Ethereum: what is the real difference?
Bitcoin and Ethereum are both crypto assets, but they are built around different purposes. Bitcoin is primarily designed as a decentralized monetary asset. Its value proposition is scarcity, censorship resistance, security, and a predictable issuance schedule. Investors often compare Bitcoin to digital gold because the thesis focuses on storing value rather than running applications.
Ethereum is a programmable blockchain. Its main innovation is not only the ETH token; it is the ability to run smart contracts. These smart contracts allow developers to build decentralized exchanges, lending protocols, stablecoin systems, NFT infrastructure, tokenized assets, gaming economies, identity tools, and many other on-chain applications. ETH is the native asset used to pay for activity on the network and can also be used in staking.
| Category | Bitcoin | Ethereum | Investor implication |
|---|---|---|---|
| Main thesis | Scarce digital money | Programmable settlement network | BTC is simpler; ETH has more moving parts. |
| Primary narrative | Store of value, monetary network | Smart contracts, applications, token economy | Different adoption drivers. |
| Supply narrative | Fixed supply cap | Dynamic supply influenced by issuance, burning, and staking mechanics | BTC is easier to model; ETH requires more protocol understanding. |
| Complexity | Lower | Higher | ETH may require more research and monitoring. |
| Portfolio role | Crypto core, digital gold allocation | Growth and utility layer | Many investors use both for different jobs. |
The mistake is assuming Bitcoin and Ethereum compete for the exact same role. They overlap because both are major crypto assets, but their investment cases are different. Bitcoin may be easier to hold for investors who want a simple long-term thesis. Ethereum may appeal more to investors who want exposure to a broader crypto economy.
Investment thesis: why investors buy Bitcoin or Ethereum
A good Bitcoin vs Ethereum comparison starts with the reason an investor would own either asset. Without a thesis, crypto investing becomes trend chasing. With a thesis, the investor can evaluate whether new information strengthens or weakens the case.
The Bitcoin investment thesis
Bitcoin’s thesis is based on monetary scarcity, network security, brand recognition, and decentralization. Supporters believe that a digital asset with a fixed supply can become a long-term store of value if enough people trust it, hold it, and use it as a hedge against currency debasement, financial repression, or excessive monetary expansion.
The strength of the Bitcoin thesis is simplicity. You do not need to forecast dozens of applications. You mainly need to believe that demand for scarce, decentralized digital money can grow over time. That simplicity can make Bitcoin easier for long-term holders to understand.
The weakness is that Bitcoin’s value depends heavily on belief, adoption, liquidity, security, regulation, and macro demand. It does not generate traditional cash flow. Investors must be comfortable with an asset whose price can move dramatically based on market sentiment.
The Ethereum investment thesis
Ethereum’s thesis is based on utility and network effects. If more applications, developers, stablecoins, tokenized assets, and users rely on Ethereum or Ethereum-connected infrastructure, ETH may benefit from demand for transaction settlement, staking, and participation in the network economy.
The strength of the Ethereum thesis is that it has more possible adoption paths. Ethereum is not only trying to be money. It is infrastructure. If blockchain-based finance, tokenization, gaming, decentralized identity, or on-chain applications grow, Ethereum may capture part of that activity.
The weakness is complexity. Ethereum faces technical risk, competition from other blockchains, scaling challenges, regulatory uncertainty, and changing fee dynamics. A stronger technology story does not automatically mean a smoother investment experience.
BTC thesis
Scarcity, security, monetary premium, and long-term store-of-value demand.
ETH thesis
Smart contracts, network usage, staking, tokenization, and application demand.
Combined thesis
BTC as crypto money, ETH as crypto infrastructure. Different assets, different jobs.
Bitcoin vs Ethereum performance and volatility
Bitcoin and Ethereum have both experienced extreme volatility. Both can rise quickly during crypto bull markets and fall sharply during crypto bear markets. A strong article should not pretend that one is “safe” simply because it has a popular narrative. Crypto is a high-risk asset class. Price paths can be emotionally difficult, even for investors with long time horizons.
Ethereum has sometimes outperformed Bitcoin during periods when investors rewarded crypto applications, DeFi activity, NFT cycles, or smart-contract growth narratives. Bitcoin has sometimes held up better when investors wanted the simpler, more established crypto asset. The winner changes by cycle, and the reason often depends on liquidity, speculation, regulation, macro conditions, and investor appetite for risk.
| Market environment | Bitcoin may benefit when... | Ethereum may benefit when... |
|---|---|---|
| Store-of-value demand rises | Investors seek a simple scarce crypto asset. | ETH may still rise, but BTC narrative may dominate. |
| On-chain application activity grows | BTC can benefit from broader crypto optimism. | Ethereum may benefit more directly from network usage. |
| Risk appetite is high | BTC often attracts capital as the crypto benchmark. | ETH may outperform if investors seek higher beta exposure. |
| Regulatory pressure increases | BTC may be viewed as simpler by some investors. | ETH may face more complex questions around staking, applications, or tokens. |
| Bear markets | BTC can still draw down heavily. | ETH can draw down heavily and may be more sensitive to application sentiment. |
The most important lesson is that performance charts can mislead when they ignore behavior. An investor who buys Ethereum after a major rally and sells during a drawdown may underperform a patient Bitcoin holder. Another investor who DCA’s into both and never sells may have a different result. The asset matters, but the strategy matters too.
Bitcoin vs Ethereum for dollar-cost averaging
Dollar-cost averaging can be useful for volatile assets because it removes the pressure of choosing one perfect entry point. Instead of trying to predict the next crypto cycle, an investor contributes a fixed amount at regular intervals. This can be especially helpful for Bitcoin and Ethereum because both assets can move sharply in short periods.
DCA does not eliminate risk. If an asset declines for years, regular buying still loses money for a long time. But DCA can reduce timing regret and create a disciplined process. For crypto investors, discipline is often more important than confidence. The hardest part is not buying during excitement; it is continuing calmly when prices fall and headlines turn negative.
DCA into Bitcoin
Best for investors who want a simple recurring crypto allocation based on scarcity and long-term store-of-value adoption.
DCA into Ethereum
Best for investors who believe smart contracts and blockchain applications will keep expanding over time.
DCA into both
Best for investors who want exposure to both crypto money and crypto infrastructure without making one single prediction.
BTC/ETH DCA allocation examples
Some investors prefer a Bitcoin-heavy allocation, such as 70% BTC and 30% ETH, because they view Bitcoin as the more established crypto store of value. Others prefer a balanced allocation, such as 50% BTC and 50% ETH, because they want both monetary and application exposure. More aggressive investors may overweight ETH if they believe Ethereum has more growth potential, but that also increases thesis complexity.
There is no universal answer. The right allocation depends on your tolerance for volatility, your understanding of each asset, and whether crypto is a small satellite position or a major part of your net worth. A small 5% crypto allocation behaves very differently from a 50% crypto portfolio.
Model it before committing: compare your own monthly contribution, time horizon, and crypto allocation with the DCA Calculator. If you want historical scenario testing, use the Investment Simulator.
Portfolio role: should Bitcoin or Ethereum be your crypto core?
Bitcoin is often easier to use as the crypto core because its thesis is narrow and durable: scarce digital money. Ethereum can also be a core holding, but it requires the investor to understand more moving pieces. ETH is linked to smart-contract demand, developer activity, scaling architecture, staking, competition, and regulatory treatment.
For many investors, the simplest structure is to keep crypto as a satellite allocation inside a broader portfolio. That broader portfolio may include ETFs, cash, bonds, real estate, or other assets. Crypto can add high-upside exposure, but it can also increase volatility dramatically. The more concentrated the crypto allocation, the more important risk management becomes.
| Investor type | Possible BTC/ETH approach | Why it may fit |
|---|---|---|
| Crypto beginner | Bitcoin-first or small BTC/ETH split | Lower complexity and easier thesis to understand. |
| Long-term growth investor | Balanced BTC/ETH allocation | Combines store-of-value and network-utility exposure. |
| High-conviction Ethereum investor | ETH overweight | Requires confidence in smart contracts, scaling, and application demand. |
| Traditional investor testing crypto | Small allocation compared with ETFs | Keeps crypto volatility from dominating the whole portfolio. |
If the goal is wealth preservation, Bitcoin may feel more natural. If the goal is exposure to blockchain-based economic activity, Ethereum may feel more compelling. If the goal is diversified crypto exposure, holding both can be reasonable, as long as the total crypto allocation fits your risk profile.
Bitcoin vs Ethereum risk comparison
Both Bitcoin and Ethereum carry serious risks. Any page claiming one is clearly safe is oversimplifying. The right question is not which asset has no risk. The right question is which risks you understand, accept, and size appropriately.
| Risk | Bitcoin | Ethereum | Investor takeaway |
|---|---|---|---|
| Volatility | Very high compared with traditional assets | Very high and sometimes higher beta than BTC | Position size matters more than confidence. |
| Regulation | Regulatory treatment can affect demand and access. | May involve additional questions around staking, applications, and tokens. | Regulatory uncertainty is part of the asset class. |
| Technical risk | Protocol changes are conservative and limited. | More complex roadmap and ecosystem dependencies. | ETH may require more ongoing research. |
| Competition | Competes mainly as digital money. | Competes with other smart-contract platforms and scaling ecosystems. | Ethereum has broader opportunity and broader competition. |
| Behavior risk | Investors may panic during major drawdowns. | Investors may chase narratives and rotate too often. | A written plan helps more than a prediction. |
Custody and security risk
Crypto investors also face custody risk. Holding assets on an exchange creates counterparty risk. Self-custody creates personal responsibility risk. Losing keys, falling for phishing, or using poor wallet practices can be financially devastating. This risk applies to both Bitcoin and Ethereum.
Before increasing crypto exposure, investors should understand storage, account security, two-factor authentication, wallet backups, tax records, and how they would handle an emergency. A strong investment thesis does not help if the asset is lost through poor custody.
Decision framework: BTC, ETH, or both?
Instead of asking which asset will outperform, ask what job each asset would do in your portfolio. This creates a more stable decision process and reduces the temptation to chase whichever coin recently performed better.
| Question | If your answer is yes | Likely direction |
|---|---|---|
| Do you want the simplest crypto thesis? | You prefer scarcity and monetary narrative. | Bitcoin may fit better. |
| Do you believe blockchains will power applications? | You want exposure to smart contracts and network usage. | Ethereum may fit better. |
| Do you want to avoid a single crypto bet? | You accept both monetary and utility theses. | A BTC/ETH mix may fit better. |
| Do you dislike complexity? | You do not want to monitor protocol and ecosystem changes. | Keep ETH smaller or focus on BTC. |
| Would a deep drawdown force you to sell? | Your behavior risk is high. | Reduce total crypto allocation. |
Bitcoin wins if
You value simplicity, scarcity, brand strength, and a store-of-value thesis more than application-level utility.
Ethereum wins if
You believe smart contracts, tokenization, stablecoins, and on-chain applications will become more important over time.
Both win if
You want diversified crypto exposure and understand that BTC and ETH represent different crypto investment theses.
Bitcoin and Ethereum inside a broader portfolio
One of the most important questions is not whether Bitcoin beats Ethereum. It is how either asset fits next to traditional investments. A portfolio made only of crypto has a completely different risk profile from a portfolio that uses crypto as a small satellite position beside broad ETFs, cash, bonds, or other long-term holdings.
Bitcoin and Ethereum can both create large upside, but they can also create large drawdowns. This is why position sizing matters. A 2% crypto allocation can add optionality without dominating the portfolio. A 20% crypto allocation can meaningfully change volatility. A 60% crypto allocation can make the entire plan depend on one asset class. None of those allocations is automatically right or wrong, but each creates a different emotional and financial experience.
Traditional ETFs are usually easier to model because they represent baskets of companies, sectors, or bonds. Crypto assets are more reflexive. Their prices can be influenced by liquidity, regulation, narratives, exchange flows, network activity, macro conditions, and speculative cycles. That does not make them unusable, but it does mean crypto should be sized with humility.
| Portfolio question | Crypto-heavy answer | Balanced answer |
|---|---|---|
| How much volatility can I accept? | High crypto allocations can swing dramatically. | Smaller crypto allocations keep volatility more manageable. |
| What if crypto underperforms for years? | The portfolio may stagnate or decline for a long stretch. | ETFs, cash, or other assets can reduce dependence on one theme. |
| What role should BTC play? | Core crypto store-of-value thesis. | Satellite exposure beside broad market investments. |
| What role should ETH play? | High-conviction smart-contract network exposure. | Smaller growth sleeve within a diversified portfolio. |
A practical approach is to decide the total crypto allocation first, then decide the BTC and ETH split. For example, an investor might choose 10% total crypto exposure, then divide it 70/30 between Bitcoin and Ethereum. Another investor might choose 5% total crypto exposure and split it equally. This process avoids a common mistake: debating BTC vs ETH endlessly without deciding how much crypto risk the portfolio should carry in the first place.
If you are comparing crypto with broad funds, read ETF vs Crypto: What the Data Says. If your goal is long-term investing behavior rather than prediction, the guide on the psychology of long-term investing can also help frame the decision.
Common mistakes when comparing Bitcoin and Ethereum
Most Bitcoin vs Ethereum mistakes come from turning a complex decision into a simple scoreboard. Investors look at whichever asset performed better recently, assume that trend will continue, and then build a portfolio around yesterday’s winner. That is not a strategy. It is performance chasing.
1. Choosing based only on recent returns
If Ethereum outperformed recently, investors may assume ETH is always better. If Bitcoin held up better during a downturn, investors may assume BTC is always safer. Both conclusions are too simple. Market cycles change, and crypto narratives rotate quickly. The better question is whether the current price reflects a thesis you understand and can hold through volatility.
2. Ignoring total crypto allocation
An investor can spend hours choosing between Bitcoin and Ethereum while ignoring the bigger decision: how much of the total portfolio should be in crypto at all. A good BTC/ETH split does not help if the total crypto allocation is too large for the investor’s risk tolerance.
3. Treating Ethereum like “Bitcoin with more upside”
Ethereum is not simply a higher-growth version of Bitcoin. It has a different purpose, different technical structure, different ecosystem dependencies, and different risks. ETH can outperform, but the reason would usually be connected to network usage, smart-contract demand, staking, scaling, and broader application growth.
4. Treating Bitcoin like it has no risk
Bitcoin is simpler than Ethereum, but simple does not mean risk-free. Bitcoin can experience major drawdowns, regulatory pressure, liquidity shocks, and long periods of weak sentiment. A strong brand does not remove volatility.
5. Forgetting custody and taxes
Crypto investing is not only about price charts. Investors need to think about exchange risk, wallet security, passwords, tax records, transaction history, and whether they understand what they are buying. Poor custody can turn a good investment decision into a permanent loss.
6. Buying without an exit or rebalancing plan
Before buying BTC or ETH, decide what would make you rebalance, reduce exposure, or add more. Without a plan, every major price move becomes emotional. A written strategy helps you distinguish between normal volatility and a real change in thesis.
Better process: define total crypto allocation, choose BTC/ETH split, decide contribution schedule, write the thesis, and review periodically. That process is more durable than guessing which coin will win the next headline cycle.
Test Bitcoin vs Ethereum with your own numbers
The best Bitcoin vs Ethereum comparison is not generic. It depends on your starting amount, contribution schedule, time horizon, risk tolerance, and allocation. A small monthly BTC/ETH contribution can behave very differently from one large purchase at a cycle peak.
Investment Simulator
Backtest crypto and ETF scenarios, DCA behavior, and long-term investment paths.
Premium DCA
Compare weighted portfolios, fees, rebalancing, withdrawals, and saved scenarios.
Related guides
Use crypto comparisons alongside ETF and long-term investing guides to avoid tunnel vision.
Frequently asked questions
Is Bitcoin or Ethereum a better investment?
It depends on the investment thesis. Bitcoin is usually better for investors who want a simpler store-of-value crypto asset. Ethereum may be better for investors who want exposure to smart contracts, applications, staking, and network utility.
Is Ethereum riskier than Bitcoin?
Ethereum can be more complex because its thesis depends on network activity, applications, scaling, staking, and competition. Bitcoin is also risky and volatile, but its investment case is generally simpler.
Should I hold both Bitcoin and Ethereum?
Many crypto investors hold both because BTC and ETH represent different roles. Bitcoin can serve as the crypto monetary asset, while Ethereum can serve as the smart-contract and application layer exposure.
What is a reasonable BTC and ETH allocation?
There is no universal allocation. Some investors prefer Bitcoin-heavy allocations, others use a balanced BTC/ETH mix, and others keep crypto small relative to ETFs and cash. The right allocation depends on risk tolerance and total portfolio size.
Is DCA good for Bitcoin and Ethereum?
DCA can help reduce timing pressure and create discipline, but it does not eliminate risk. Bitcoin and Ethereum can both decline sharply, so the contribution size should be realistic.
Can Ethereum outperform Bitcoin?
Ethereum can outperform Bitcoin during periods when investors reward smart-contract adoption, application activity, or higher-risk crypto exposure. Bitcoin can outperform when the market favors the simpler store-of-value narrative.
Final verdict: Bitcoin vs Ethereum
Bitcoin and Ethereum are not interchangeable. Bitcoin is the simpler scarce-asset thesis. Ethereum is the broader programmable-network thesis. Bitcoin may fit investors who want digital store-of-value exposure. Ethereum may fit investors who believe blockchain applications and smart contracts will become more valuable over time.
The strongest answer for many investors is not BTC or ETH in isolation. It is a thoughtful allocation sized inside a diversified portfolio. Crypto can create major upside, but it can also create major drawdowns. The best investment is the one you understand well enough to hold responsibly through volatility.
Educational simulation only. Historical performance does not guarantee future results. Crypto assets are highly volatile and can lose substantial value.