How to Compare Investment Strategies Before Investing
To compare investment strategies well, do not only ask which one had the highest final value. Compare assumptions, contributions, risk, drawdowns and whether you could actually follow the plan through bad markets.
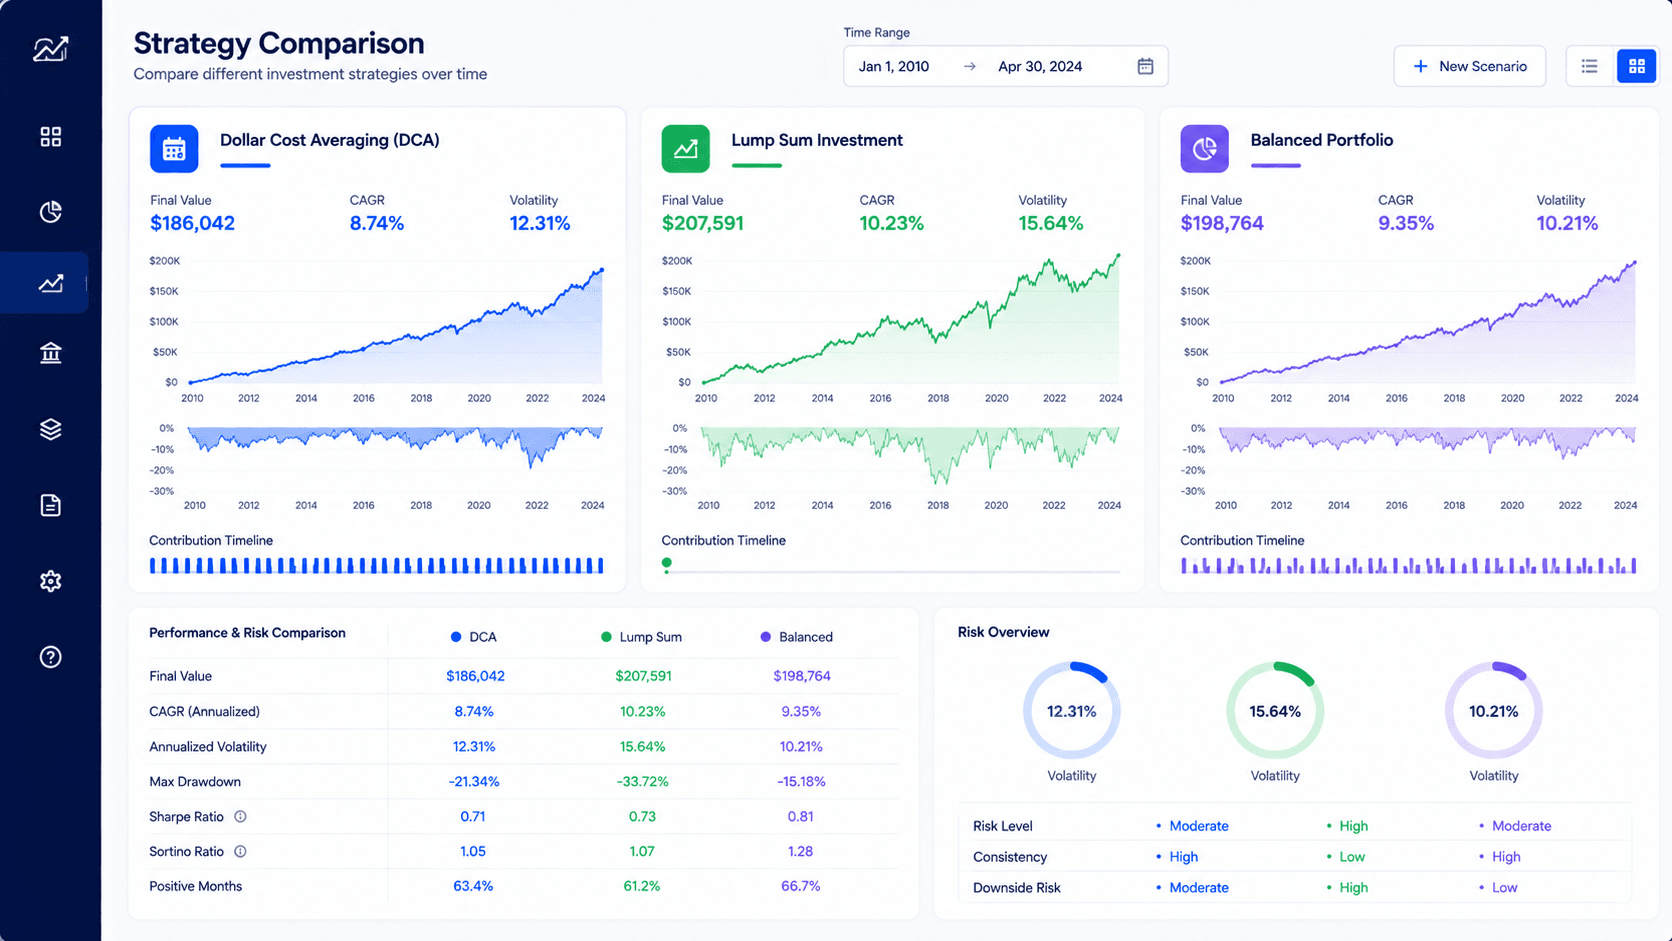
Quick answer: how to compare investment strategies
The cleanest way to compare investment strategies is to run each strategy through the same assumptions, then evaluate more than the ending balance. Use the same asset, start date, end date, contribution size, fees, reinvestment assumption and currency. Then compare final value, total invested, volatility, drawdown, time under water, worst start date, simplicity and how much discipline each strategy demands.
When you compare investment strategies this way, the decision becomes less emotional. You stop asking which chart looks most impressive and start asking which plan is strong enough to repeat.
A strategy that looks best on a chart may be hard to follow in real life. A lump sum strategy may produce a higher ending value in many historical periods, but it also asks the investor to commit capital immediately and tolerate the full market decline from day one. A DCA strategy may reduce timing regret, but it can underperform in fast rising markets because some cash waits on the sidelines. A concentrated stock or crypto strategy may show spectacular upside, but the emotional and portfolio risk can be far larger than a diversified ETF plan.
Compare investment strategies as decision systems, not as isolated performance charts. The question is not only "which strategy won?" It is "which strategy had the best trade-off between return, risk, behavior and repeatability for my goal?"
That is why WhatIfInvested is built around the sequence Simulate. Compare. Understand. Start with the Investment Simulator, compare the result against alternatives, then use the article and tool ecosystem to understand what the numbers actually mean.
What counts as an investment strategy?
An investment strategy is not just the asset you buy. It is the full set of rules that determine how money enters the market, what it buys, how long it stays invested, how often the plan changes and what the investor does when the market moves against them. Two people can both invest in the S&P 500 and still follow very different strategies if one invests a lump sum, another invests monthly, and another changes allocation based on short-term news.
For a strategy comparison to be useful, the strategy must be specific enough to test. "Invest for the long term" is a good principle, but it is not yet a testable strategy. "Invest $500 per month into a broad market ETF for 15 years" is testable. "Invest $10,000 today into Bitcoin and compare it with monthly DCA over the same period" is testable. "Split contributions between stocks and crypto based on a fixed allocation" is testable.
Does money enter all at once, monthly, quarterly, after a decline, or by another rule?
Does the plan buy one ETF, several ETFs, stocks, crypto, or a mixed portfolio?
Does the plan hold for a fixed period, rebalance, withdraw, or compare scenarios before acting?
Once these rules are clear, the strategy becomes easier to simulate. This is also where many beginner comparisons fail. They compare one finished result against another without defining whether the inputs were fair. A 10-year Bitcoin DCA result and a 30-year S&P 500 lump sum result are not directly comparable unless the purpose of the comparison is clearly explained. Time frame, asset class and contribution behavior all change the outcome. To compare investment strategies fairly, the rules need to be visible before the results are judged.
The strategy comparison framework
A strong framework helps you compare investment strategies without getting distracted by the biggest number on the page. The goal is to create a repeatable process that works for DCA, lump sum, ETF portfolios, crypto allocations, retirement simulations and future planning. Use the same framework every time so the decision stays consistent.
This is especially useful for a SaaS workflow because the same structure can guide a quick free simulation today and a more detailed Premium planning workflow later.
Define the goal
Start with the decision you are trying to make. Are you deciding how to invest new cash, whether to DCA into a volatile asset, how to compare two ETFs, or whether a portfolio mix supports a long-term goal? A retirement plan, a Bitcoin accumulation plan and a short-term cash deployment decision should not be judged by the same emotional standard.
Use matched assumptions
Compare each strategy with the same start date, end date, currency, contribution amount and asset data when possible. If one strategy gets a better period or a more favorable contribution schedule, the result may look more precise than it really is. Matched assumptions make the comparison cleaner.
Compare risk along the path
Final value is important, but the path matters. A strategy that ends with more money can still be harder to follow if it drops 55 percent along the way. Look at drawdown, recovery time and how often the strategy would have felt uncomfortable.
Compare behavior required
Some strategies only work if the investor keeps buying during declines, avoids panic selling and ignores short-term noise. If the plan requires behavior you are unlikely to repeat, the strategy is weaker in practice than it appears in a backtest.
Turn the result into a next step
A comparison should lead to action. If DCA reduces regret, decide the contribution schedule. If lump sum wins but feels too stressful, consider a hybrid. If an asset looks attractive but too volatile, reduce allocation size. A good comparison should make the next decision clearer.
| Comparison layer | Question to ask | Why it matters |
|---|---|---|
| Return | Which strategy produced the highest final value? | This is the simplest result, but it should not be the only result. |
| Contribution | How much total money was invested? | Two strategies can have similar final values with very different contribution patterns. |
| Drawdown | How far did the strategy fall from peak to trough? | Large drawdowns test discipline and often determine whether the plan survives. |
| Timing | How sensitive is the result to the start date? | A strategy that only works when started at the perfect time may be fragile. |
| Behavior | Could the investor repeat this plan under stress? | Real returns depend on execution, not only the historical chart. |
Compare DCA vs lump sum without oversimplifying
One of the most common ways to compare investment strategies is to test dollar-cost averaging against lump sum investing. This is useful, but it is often oversimplified. Many articles treat the comparison as a permanent debate where one side must win. In reality, DCA and lump sum solve different investor problems.
Lump sum investing answers the question: "What happens if all available money is invested now?" DCA answers the question: "What happens if money enters the market gradually?" If markets rise quickly after the start date, lump sum often looks better because more capital was exposed to gains earlier. If markets decline soon after the start date, DCA can feel easier because some cash is still waiting to buy at lower prices.
The right comparison depends on whether you already have the cash. If you receive a bonus, inheritance or large cash balance, lump sum versus staged entry is a real decision. If your investing money comes from monthly income, DCA is not only a strategy. It is also the natural cash flow pattern of your life. This is why you should compare investment strategies against your real cash flow, not only against a textbook example.
You invest from income, want a repeatable habit, worry about bad timing, or need a plan that reduces regret during volatile markets.
You already have cash, have a long horizon, accept immediate market exposure and can tolerate seeing the full amount fluctuate.
For a dedicated breakdown, use the guide on DCA vs lump sum. For contribution planning, use the DCA Calculator. For broader historical testing across assets, use the Investment Simulator.
Compare historical return, drawdown and timing risk
Historical return is the number most investors notice first, but the better comparison starts with the full path. A strategy that compounds at a high rate but spends years in a deep drawdown may be unsuitable for someone who needs stability. A strategy with lower returns but smoother behavior may be more realistic for an investor who is still building confidence.
Drawdown matters because it measures the pain between the starting point and the ending point. If a portfolio falls from $100,000 to $60,000 before recovering, the ending value does not fully describe the experience. The investor had to stay disciplined while seeing a 40 percent decline. That is not a spreadsheet problem. It is a behavior problem. Any serious attempt to compare investment strategies should include this pressure, not hide it.
Timing risk also matters. A strategy can look excellent when the start date is favorable and weak when it begins before a major crash. When you compare investment strategies, test more than one start date when possible. A plan that only works in one perfect historical window is less reliable than a plan that remains reasonable across different periods.
Backtests help you understand how a strategy behaved in the past. They do not guarantee future results. Treat them as decision support, not prediction. For general investor education, official resources such as Investor.gov investing basics can help frame the limits of risk and return assumptions.
| Metric | What it shows | How to interpret it |
|---|---|---|
| Final value | The ending balance of the strategy. | Useful, but incomplete without knowing risk and contributions. |
| Total invested | The amount of capital contributed. | Helps separate return from contribution size. |
| Gain or loss | The difference between final value and total invested. | Shows how much came from market movement. |
| Drawdown | The decline from a previous high. | Shows the emotional pressure required to continue. |
| Recovery time | How long the strategy took to regain prior highs. | Important for investors with shorter timelines. |
Compare strategy fit by goal, time horizon and behavior
A strategy can be mathematically strong and still be a poor fit. This is one of the most important lessons in portfolio design. A retiree, a new investor, a high-income accumulator and a crypto trader may all look at the same historical chart and make different rational choices. That is why investors should compare investment strategies through the lens of their own goals.
For long-term wealth building, the investor often needs repeatability more than excitement. A simple strategy that can be followed for 20 years may beat a complex strategy that gets abandoned after two stressful quarters. For short-term goals, risk control may matter more than maximizing expected return. For speculative assets, position size may be more important than whether the asset had the highest past return.
Does the strategy support the actual goal, such as retirement, emergency savings, education, house down payment or long-term accumulation?
Does the time horizon allow the strategy to recover from normal volatility, or is the money needed too soon?
Can the investor keep following the strategy when the chart looks ugly and the news feels frightening?
This is where the "Understand" layer matters. The strategy comparison should not push every user toward the most aggressive choice. It should help the user understand the trade-off. A lower return with higher confidence may be the better plan for some goals. A higher return with extreme volatility may be appropriate only for a small sleeve of a broader portfolio.
How to test strategies in the WhatIfInvested Simulator
The WhatIfInvested Investment Simulator is the best starting point when you want to compare investment strategies with historical data. Use it when you need to test how a strategy might have behaved across stocks, ETFs, crypto or a simple portfolio setup. The free version is especially useful for quick comparisons before you decide whether deeper planning is needed.
Start by choosing the asset or assets you want to test. Then set the period, contribution amount and contribution frequency. Run the first scenario and write down the final value, total invested and gain. Next, change only one variable. For example, keep the asset and period the same but compare monthly DCA with a different contribution amount. Or compare the same recurring investment across two assets.
Change one major variable at a time. If you change asset, timeline, contribution amount and frequency all at once, you will not know which factor caused the difference.
For recurring contribution planning, the DCA Calculator can help turn a broad idea into a monthly investment plan. For all available public tools, use the calculators and tools hub. For methodology and data interpretation, the guides on how to backtest your investment strategy, portfolio backtesting for beginners and whether investment simulators are accurate provide the context around what the results can and cannot tell you.
Common mistakes when comparing strategies
The first mistake is comparing strategies with unfair inputs. If one strategy gets a better start date, more total capital or a different asset class, the conclusion may be misleading. A fair comparison does not have to be perfect, but the assumptions should be transparent.
The second mistake is ignoring risk. Many investors choose the strategy with the highest final value, then discover they cannot tolerate the drawdown required to get there. A strategy that you abandon during the first major decline is not a real strategy. It is a backtest you liked when conditions were calm.
The third mistake is treating historical performance as a forecast. The past can reveal how a strategy behaved under certain conditions, but it cannot promise the future. Use historical data to understand ranges, stress points and trade-offs. Do not use it as a guarantee.
The fourth mistake is comparing too many ideas at once. If you test five assets, three contribution amounts, four time periods and two risk assumptions in one sitting, the result becomes noisy. Start simple. Compare two strategies. Understand the difference. Then expand the test.
The fifth mistake is forgetting the investor. The strategy does not exist in isolation. It belongs to a person with income, expenses, fears, goals and habits. The best plan on paper may be a bad plan for the person expected to execute it.
| Mistake | Why it hurts the decision | Better approach |
|---|---|---|
| Only checking final value | It ignores the emotional path and risk taken. | Review drawdown, recovery and contribution behavior. |
| Mixing unmatched periods | It can make one strategy look unfairly strong. | Use the same start and end date when possible. |
| Ignoring fees and taxes | Real net results may differ from clean simulations. | Treat the simulation as a gross planning layer unless fees are modeled. |
| Overfitting to history | The best past winner may be a fragile future plan. | Favor strategies that make sense across more than one environment. |
FAQ: compare investment strategies
What is the best way to compare investment strategies?
The best way to compare investment strategies is to use the same assumptions for each strategy, then compare final value, total invested, drawdown, timing risk, volatility and whether the strategy is realistic for your behavior and goal.
Should I compare DCA and lump sum before investing?
Yes, especially if you already have a lump sum available. DCA and lump sum solve different problems. Lump sum maximizes immediate exposure, while DCA can reduce timing regret and make the plan easier to follow.
Can I backtest an investment strategy?
You can backtest many investment strategies with historical data if the rules are clear enough to test. The result can help you understand past behavior, but it should not be treated as a prediction of future returns.
What numbers matter most when comparing strategies?
Final value matters, but it should be reviewed alongside total invested, gain, drawdown, recovery time, contribution frequency, time horizon and the investor behavior required to stay with the plan.
Is historical performance enough to choose a strategy?
No. Historical performance is useful, but it is not enough by itself. You also need to consider risk, fees, taxes, diversification, time horizon, liquidity needs and whether you can follow the strategy through bad markets.
When should I use Premium tools?
Premium tools become useful when you need saved scenarios, deeper comparisons, exports, multiple portfolios or a more organized planning workflow than a single quick simulation can provide.
Can I compare ETF, stock and crypto strategies?
Yes, but the comparison should be honest about risk. ETFs, individual stocks and crypto assets can have very different volatility, drawdowns and concentration risk, so the final value should not be the only metric.
Conclusion: compare the plan, not just the result
To compare investment strategies well, you need more than a winning chart. You need a clear goal, matched assumptions, risk context, behavior context and a next step. A strategy that earns more in one historical window may not be better if it depends on perfect timing or requires behavior you cannot repeat.
Start simple. Run one clean comparison in the Investment Simulator. Then use the result to ask better questions: What changed the outcome? Was the drawdown acceptable? Did contributions matter more than timing? Would you really follow this plan during a bad year? That is where simulation becomes useful. It turns investing from a guess into a structured decision.