Investing in 2008: What the Crisis Taught Long-Term Investors
Investing in 2008 felt nothing like an obvious opportunity. Banks failed, stock prices collapsed, and many people sold because the future felt unknowable. This guide studies what happened when an investor kept buying instead of freezing.
Investing in 2008: what this case study shows
A useful 2008 backtest is not just about the final return. It is about drawdown, behavior, recovery time, and whether the investor could stay with the plan while the market still looked broken.
The dashboard view below frames the crisis as a decision system: compare lump sum, DCA, and hybrid approaches, then judge the path as much as the ending value.
Quick Answer: Investing in 2008 Rewarded Patience, But Tested Nerves First
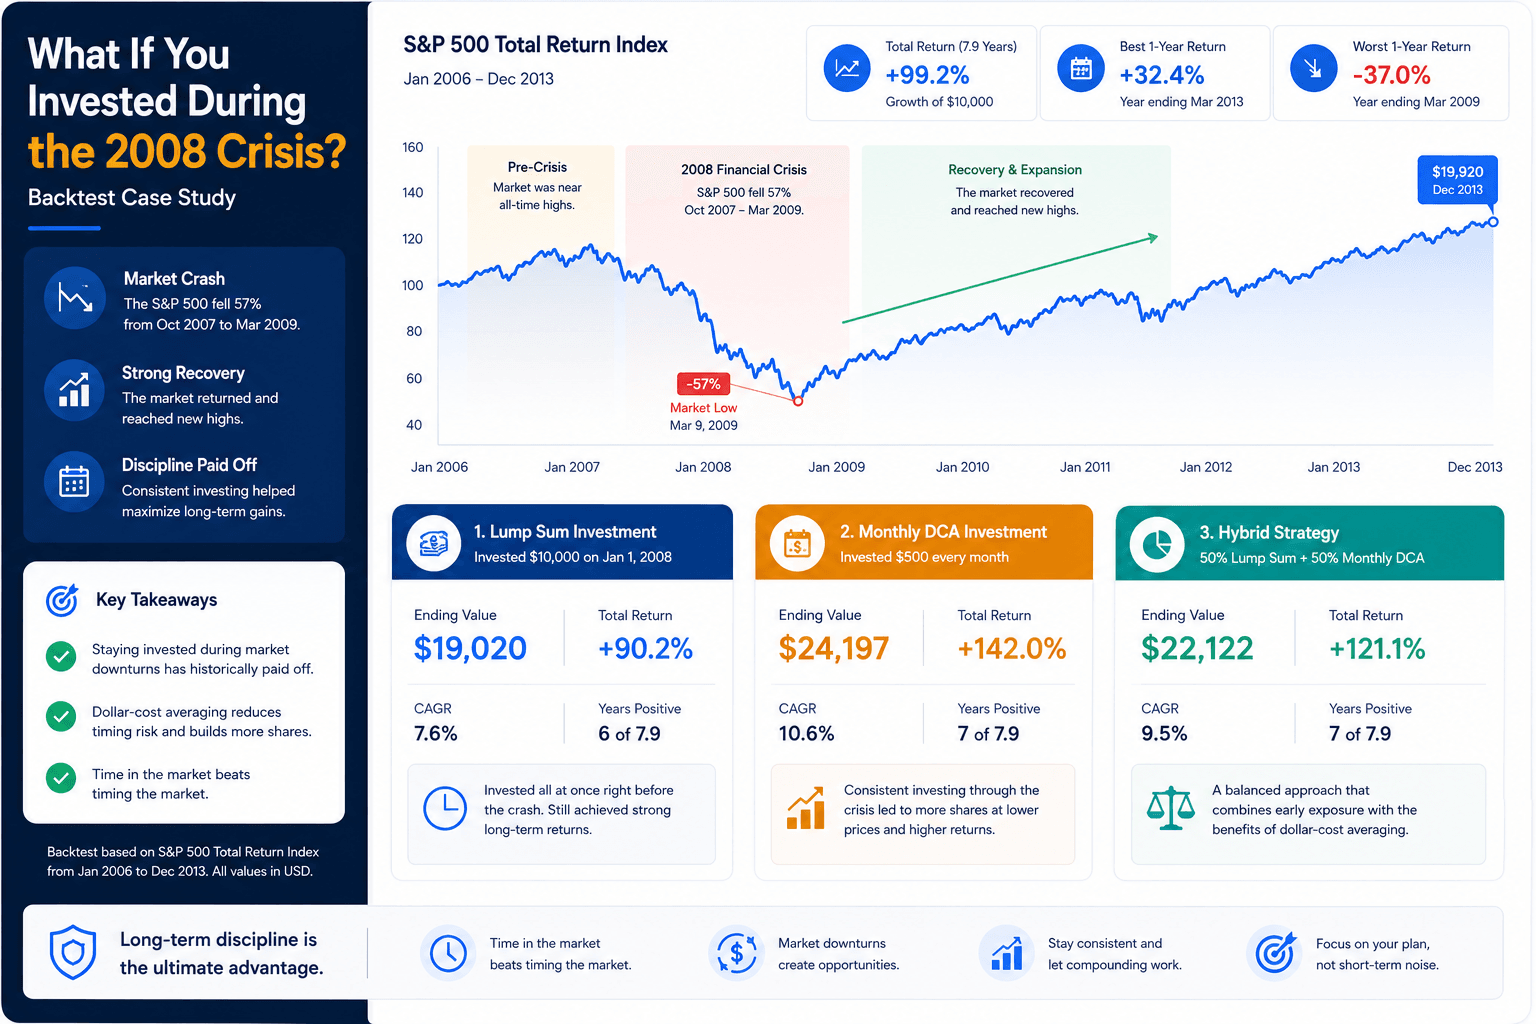
Investing in 2008 could have produced strong long-term results, but only for investors who had enough time, liquidity, and emotional discipline to keep holding through severe drawdowns. A lump sum near the panic period eventually benefited from the recovery, while a dollar-cost averaging plan helped reduce timing pressure and made it easier to buy when prices were falling.
The most important lesson is not that every crash is automatically a buying opportunity. The lesson is that crisis investing works only when the strategy is built before the crisis, not invented in the middle of panic. Investors who had emergency savings, a diversified portfolio, and a contribution plan had a much better chance of staying invested than those who needed their money soon.
Buying during a crash can look obvious in hindsight. In real time, it feels uncomfortable because news, job risk, and account losses all point in the opposite direction. A backtest should measure the final value and the pain required to reach it.
This case study is most useful for investors comparing lump sum, monthly contributions, and hybrid strategies during market stress. To test your own numbers, use the Investment Simulator or model recurring deposits with the DCA Calculator.
2008 Crisis Timeline: What Investors Were Actually Facing
The 2008 crisis did not arrive as one clean event. It unfolded through a series of credit shocks, bank failures, emergency policy responses, and market selloffs. That matters because investors did not know where the bottom was. They had to make decisions while the story was still developing.
When people ask whether they should have invested during 2008, they often imagine a single button pressed exactly at the bottom. Real investors rarely get that luxury. They invest before the bottom, after a large drop, during a rebound that may fail, or slowly over time as cash becomes available.
Subprime mortgage stress began spreading through financial products that many investors did not fully understand. Equity markets were still near highs for part of the year, which made the risk easy to underestimate.
The failure of a major investment bank showed that the problem was bigger than a housing slowdown. Credit markets started to question who else might be exposed.
The bankruptcy turned a severe credit problem into a full panic. Markets sold off aggressively, liquidity dried up, and the phrase "financial crisis" became unavoidable.
The S&P 500 bottomed after a brutal decline. This was an extraordinary entry point in hindsight, but in real time investors were surrounded by fear, recession data, and uncertainty.
Investors who stayed invested through the recovery benefited from earnings growth, monetary support, and renewed risk appetite. The challenge was surviving emotionally and financially long enough to participate.
For historical context, the Federal Reserve History overview of the Great Recession and its aftermath is a useful reference for understanding the crisis environment. For methodology context, the WhatIfInvested methodology page explains how historical simulation assumptions affect results. This is important because dividends, fees, start dates, and contribution timing can meaningfully change the outcome.
Three 2008 Investment Scenarios Worth Comparing
A good 2008 case study should compare more than one investment behavior. A perfect bottom-timing scenario is interesting, but not realistic for most people. The more useful comparison is between strategies an ordinary investor could have followed without knowing the future.
Lump Sum During Panic
The investor commits a larger amount near the crisis period. This can work very well if the entry point is favorable and the investor can tolerate deep temporary losses. It is also emotionally difficult because the account can fall further after the purchase.
Monthly DCA
The investor contributes a fixed amount every month. This approach reduces the need to pick the exact bottom and creates a rule for buying more shares when prices are lower. It may underperform a perfectly timed lump sum, but it is often easier to execute.
Hybrid Strategy
The investor puts some money to work immediately and keeps contributing monthly. This balances market exposure with flexibility. It can be useful when an investor wants to participate in the recovery without committing every dollar at once.
The right scenario depends on the investor's cash reserves, job stability, time horizon, and ability to watch losses without abandoning the plan. Someone investing for retirement over 25 years can behave differently from someone who needs the money for a home down payment in two years.
How to Backtest Investing During the 2008 Crisis
Backtesting 2008 is useful, but it can easily become misleading if the assumptions are too clean. The goal is not to create a perfect hindsight story. The goal is to build a realistic framework that shows what a strategy might have felt like while it was happening.
At minimum, a 2008 backtest should define the asset, start date, end date, contribution schedule, dividend handling, and whether fees are included. It should also show maximum drawdown, not just final value. A strategy that ends higher but falls 45% along the way may not be suitable for every investor.
| Assumption | Why it matters | Common mistake |
|---|---|---|
| Start date | Moving the start date by a few months can change results dramatically during a crash. | Picking the exact bottom after seeing the chart. |
| Contribution schedule | Monthly, weekly, and lump sum behavior create different cash-flow and risk profiles. | Comparing unequal invested amounts. |
| Dividends | Reinvested dividends can materially affect long-term equity returns. | Using price-only charts and ignoring distributions. |
| Fees and taxes | Trading costs, fund fees, and taxes reduce real investor outcomes. | Assuming every backtest is frictionless. |
| Drawdown | The largest fall from peak to trough measures the emotional test. | Only looking at final value. |
For a deeper guide to the mechanics, read How to Backtest Your Investment Strategy. If you want a broader explanation of simulation quality, read How Accurate Are Investment Simulators?.
Results: Why Final Value Is Only Half the Story
In most long-term 2008 simulations, the investor who continued buying broad U.S. equities eventually benefited from the recovery. The exact numbers depend on the chosen dates and assumptions, but the behavioral pattern is consistent: the worst period often happened before the strongest gains.
The investor who put money to work in late 2008 or early 2009 was buying after a major market decline. That created attractive long-term return potential, but it did not eliminate short-term risk. Prices could still fall, news could still worsen, and the recovery could take longer than expected.
| Strategy | Strength | Main risk | Best investor fit |
|---|---|---|---|
| Lump sum | Captures more upside if invested before a strong recovery. | Higher regret risk if the market falls further after entry. | Investor with long horizon, strong cash reserve, and high risk tolerance. |
| DCA | Reduces timing pressure and buys across several market levels. | Can lag a lump sum if the market rebounds quickly. | Investor who earns income monthly and wants a repeatable process. |
| Hybrid | Balances immediate exposure with ongoing flexibility. | May not maximize either the best lump sum or best DCA outcome. | Investor who wants a compromise between action and caution. |
A realistic results section should include the time needed to recover from losses. If the account was down heavily for months or years, the investor needed conviction to keep going. That is why the 2008 lesson is as much psychological as mathematical.
DCA vs Lump Sum During 2008: Which Strategy Was Better?
The answer depends on the exact entry date. If a lump sum was invested close to the market bottom, it likely produced a powerful long-term result. If the lump sum was invested too early, the investor had to sit through painful losses before the recovery arrived. DCA helped smooth that entry risk by spreading purchases over time.
This is why a general rule like "lump sum always wins" or "DCA is always safer" is incomplete. Lump sum often has the stronger expected return when markets rise over time, because more money is invested earlier. DCA often has the stronger behavioral fit when uncertainty is extreme, because it turns a terrifying decision into a repeatable schedule.
For an investor during 2008, the most realistic question was not "Which strategy wins in a spreadsheet?" It was "Which strategy can I actually follow while the market, economy, and job outlook are all under pressure?" That question matters because an abandoned strategy does not get to enjoy the recovery.
To compare this topic in more detail, see DCA vs Lump Sum: Which Strategy Wins Over Time? and How DCA Would Have Performed During the 2008 Crisis.
Seven Lessons Investors Can Take From 2008
The 2008 crisis is one of the best stress tests for investor behavior because it combined a market crash with a real economic crisis. Many investors were not only worried about their portfolios. They were worried about jobs, banks, housing, and the stability of the financial system.
Cash is strategy
An emergency fund is not dead money during a crisis. It protects the investment plan by reducing the chance that you must sell stocks at the worst possible time.
Drawdowns are real
A 50% market decline is not just a chart event. It tests identity, confidence, and household planning. Every backtest should ask whether the investor could hold through the decline.
Rules beat guesses
A prebuilt contribution plan can help investors avoid emotional decisions. Buying every month is easier to follow than trying to decide whether the news is finally safe.
Diversification helps
Owning only one risky asset can make a crisis feel unbearable. A diversified portfolio may still fall, but it can reduce the odds of a complete emotional break.
Recovery is uneven
Markets do not recover in a straight line. Rallies can fail, new lows can appear, and patience may be required long after the headlines improve.
Time horizon matters
Crisis investing favors money that can stay invested for years. Short-term money belongs in safer places because the market can remain volatile longer than expected.
Lesson 7: The best plan is the one you can still follow when it looks wrong
Many strategies look intelligent during calm markets. The true test is whether the same strategy is still usable when the account is down, the news is negative, and friends are selling. A 2008 simulation is valuable because it shows the gap between theoretical return and emotional execution.
How to Build a Modern Crisis Investing Plan
Investors today do not need to copy a 2008 strategy exactly. The market structure, interest rates, asset choices, and personal circumstances may be different. But the planning principles remain useful.
- Separate emergency cash from investment cash. Money needed within the next few years should not depend on a stock market recovery.
- Define the contribution rule before volatility arrives. Decide how much you can invest monthly through normal and stressed periods.
- Know your maximum pain point. If a 40% drawdown would make you sell, your allocation may be too aggressive.
- Use broad diversification. A single-stock crisis plan is much riskier than a broad market or diversified portfolio plan.
- Review, but do not overreact. A crisis plan needs maintenance, not constant emotional rebuilding.
- Track costs and taxes. Fees, spreads, taxes, and fund expense ratios matter more over long horizons than most beginners expect.
If you are building a monthly investing habit from scratch, the Best Dollar-Cost Averaging Strategies guide gives a broader framework. If you need to free up monthly cash flow first, use WhatIfBudget before increasing your contribution amount.
What 2008 Teaches About Investor Behavior
The hardest part of crisis investing is not calculating the expected return. It is staying consistent while the facts feel unstable. In 2008, investors were not simply reacting to a normal correction. They were watching a credit system break in public. That created a different kind of fear from a short, technical selloff.
Many long-term investors say they want to buy when prices fall, but the opportunity usually arrives wrapped in bad news. During the crisis, cheaper prices came with recession risk, layoffs, housing losses, bank failures, and uncertainty about whether policy makers could stabilize the system. That is why a backtest should never be treated as a simple scoreboard. It should be treated as a behavior rehearsal.
A useful behavior rehearsal asks practical questions. Would you continue contributing if your account was down month after month? Would you rebalance into stocks after they had fallen sharply? Would you still trust the plan if friends, coworkers, and media headlines were all negative? Would your household cash flow allow you to keep investing if income became less secure?
The investors who benefited most from the recovery were not necessarily the people with the most complicated models. They were often the people with a simple structure: an emergency fund, diversified holdings, automatic contributions, and a written plan that prevented panic selling. The plan did not remove fear, but it reduced the number of decisions that had to be made while fear was highest.
How Different Investors Might Have Experienced the Same Crisis
The same 2008 market data can mean very different things depending on the investor. A 30-year-old contributing to retirement accounts had decades to recover. A 62-year-old preparing to retire had sequence-of-return risk. A family saving for a house could not treat market volatility as temporary if the money was needed soon. A business owner facing uncertain income had to think about liquidity before return.
This is why personal context matters more than the historical chart alone. A long-term investor with steady income could view lower prices as an opportunity to accumulate shares. A short-term investor with unstable income might have needed to preserve cash. Both decisions could be rational because the portfolio is only one part of the household balance sheet.
| Investor type | Likely priority in 2008 | Better simulation focus |
|---|---|---|
| Young accumulator | Keep contributions going and avoid panic selling. | DCA schedule, long-term final value, and behavior through drawdown. |
| Near-retiree | Protect spending needs and reduce sequence risk. | Withdrawal timing, bond allocation, cash reserve, and drawdown depth. |
| House down-payment saver | Preserve capital needed in the near term. | Short-term downside risk and cash alternatives. |
| High-income saver | Deploy excess cash without overconcentrating risk. | Hybrid strategy, contribution capacity, and rebalancing rules. |
When using a historical simulator, start with your real situation. The question is not only what SPY did after 2008. The question is whether your actual plan would have survived the path from panic to recovery.
Common Backtesting Errors When Studying 2008
The 2008 crisis is popular in investment content because it creates dramatic charts. But dramatic charts can lead to poor conclusions if the backtest is built carelessly. The most common error is hindsight timing: selecting the lowest month and implying that the decision was obvious. A better test compares several reasonable entry points, including dates before and after the low.
Another error is comparing strategies with different amounts invested. If the lump sum investor deploys 10,000 dollars immediately and the DCA investor deploys only 100 dollars per month, the comparison is partly about timing and partly about total capital. A fair comparison should make the invested amounts clear and explain what each scenario is trying to measure.
A third error is ignoring dividends and fees. Broad equity returns over long periods can be meaningfully affected by reinvested distributions. Fees and transaction costs can also change results, especially for frequent contribution strategies. The goal is not to make the model painfully complex. The goal is to avoid pretending that every investor received the cleanest possible chart return.
The final error is ignoring investor survival. A strategy that looks good at the end but requires holding through a devastating drawdown may not be realistic for everyone. This is why Premium-style scenario testing can be useful: it lets you compare drawdowns, fees, allocation mixes, benchmarks, and saved scenarios instead of relying on one simplified chart.
How a 2008 Investor Could Have Used Monthly Contributions
A monthly contribution plan was especially useful during 2008 because it separated the investment decision from the emotional news cycle. Instead of asking whether today was the perfect day to buy, the investor followed a scheduled rule. That rule did not guarantee the best possible entry point, but it reduced the need to make a high-pressure decision every time the market moved.
Consider the psychology of investing 100 dollars per month during the crisis. In a rising market, the contribution buys fewer shares. In a falling market, the same contribution buys more shares. That is the mechanical advantage of DCA: it turns lower prices into higher share accumulation. The investor still experiences losses on previous purchases, but each new contribution is made at a lower valuation.
This is why DCA is often less about maximizing the theoretical return and more about improving execution. A person who would never invest 10,000 dollars during panic might still invest 100 or 500 dollars per month. If the smaller recurring plan keeps the investor engaged through the recovery, it may be more valuable than a larger strategy that is abandoned halfway through.
There is also a cash-flow advantage. Most people do not receive all investable money at once. They save from paychecks. A monthly DCA plan matches how income actually arrives. During a recession, that match matters. The investor can adjust savings rate if income changes while still keeping a baseline habit alive when possible.
The weakness is opportunity cost. If the investor already had a large amount of idle cash and markets recovered quickly, spreading purchases over many months could leave too much money uninvested. That is why a hybrid approach can be appealing. It puts some capital to work immediately while using monthly contributions to manage regret and uncertainty.
What a Lump Sum Investor Needed to Survive 2008
A lump sum investor during 2008 needed more than courage. They needed a reason to believe the money could remain invested for years. Without that time horizon, a lump sum into a falling market could become dangerous. The market can remain irrational, stressed, or depressed longer than an investor expects.
The first requirement was liquidity. If the investor used emergency money, job-loss money, or near-term purchase money, the strategy was fragile from the start. A market recovery does not help if the investor is forced to sell during the decline. The second requirement was asset quality. Buying a diversified index is very different from buying a company that might not survive the crisis.
The third requirement was emotional precommitment. A lump sum investor had to accept that the account might fall immediately after purchase. This is difficult because loss aversion makes early losses feel like proof that the decision was wrong. In reality, short-term losses are common even after historically attractive entry points.
The fourth requirement was a rebalancing plan. If stocks fell sharply, a balanced portfolio might require adding to equities to restore the target allocation. That is easy to write in an investment policy statement and hard to do in a panic. Investors who rebalanced systematically had a framework for buying weakness without pretending they knew the exact bottom.
This is why lump sum investing is not just a return decision. It is a capacity decision. If the investor has the financial and emotional capacity to stay invested, the historical odds often favor getting money into the market sooner. If that capacity is weak, a staged or DCA approach may produce better real-world behavior.
Why the Recovery Felt Less Obvious Than It Looks Now
Looking backward, the recovery after 2009 appears clean. The market bottom is visible on a chart, the rebound is visible, and the decade that followed looks like a powerful expansion. But investors in 2009 did not see the chart from the future. They saw a damaged economy and a market that had already punished confidence several times.
Early recoveries often look like temporary rallies. Investors who had been hurt during the decline could easily believe that every bounce was another trap. This is called recency bias: recent pain makes future pain feel more likely. After a major crash, investors often require much more evidence before trusting the recovery, which means they may miss a large part of the rebound.
There was also social pressure. When people around you are fearful, conservative, or selling, staying invested can feel irresponsible. A good historical case study should acknowledge this pressure. It is not enough to say the investor should have held. The better question is what system would have made holding easier.
Automatic contributions, written rules, diversified funds, and a clear separation between emergency cash and investment cash all help. They do not make volatility pleasant. They make volatility survivable. That distinction is the difference between a strategy that exists in a spreadsheet and a strategy that works in a real household.
The recovery also rewarded investors who avoided all-or-nothing thinking. Someone who was too scared to invest every dollar could still invest part of the plan. Someone who had stopped contributing could restart gradually. The goal was not perfection. The goal was participation in the recovery without taking risks that would force capitulation.
How to Use This Case Study Without Overfitting to 2008
One risk with any historical case study is overfitting. Investors may study one crisis so closely that they expect the next crisis to behave the same way. That is dangerous. The next major downturn may involve different causes, different policy responses, different inflation conditions, different valuations, and different recovery speed.
The useful lesson from 2008 is not that every crisis creates the same buying opportunity. The useful lesson is that a disciplined process can turn uncertainty into a series of manageable decisions. The process can include broad diversification, recurring contributions, rebalancing rules, cash reserves, and scenario testing.
To avoid overfitting, test multiple time periods. Compare 2008 with the dot-com crash, the 2020 pandemic shock, inflationary periods, and slower bear markets. If a strategy only works when you choose one perfect period, it may not be robust. If it works across several difficult environments, it deserves more attention.
Also test uncomfortable assumptions. What if contributions stop for six months because of job loss? What if the investor begins six months before the bottom instead of at the bottom? What if fees are higher? What if withdrawals are needed? These questions make the simulation more realistic and can reveal weaknesses before real money is at risk.
This is where the Premium workflow becomes useful for serious scenario planning. A simple free backtest can answer what happened. A deeper scenario tool can answer what might happen to your specific plan if fees, benchmarks, rebalancing, withdrawals, and multiple portfolios are included. That is a much better way to convert historical data into a personal decision framework.
Test a 2008-Style Scenario With Your Own Numbers
The strongest way to understand crisis investing is to change the inputs: starting amount, monthly contribution, dates, asset choice, and time horizon. The free simulator is useful for quick historical tests. Premium is built for deeper strategy work such as multiple portfolios, fees, benchmarks, rebalancing, withdrawals, saved scenarios, and exportable reports.
Related Guides for Crisis Investing and Backtesting
These guides continue the same research path and help you compare the 2008 case against broader market behavior.
Frequently Asked Questions
Was 2008 a good time to invest?
In hindsight, investing in 2008 became a strong long-term opportunity for broad-market investors who held through the recovery. In real time, it was difficult because markets kept falling and the economic outlook was deeply uncertain. The lesson is to use a plan, not hindsight confidence.
Was DCA better than lump sum during the 2008 crisis?
It depends on the exact start date. A lump sum near the bottom could outperform, while DCA reduced timing risk and made it easier to keep buying through fear. For many real investors, DCA was more behaviorally realistic even if a perfectly timed lump sum looked better later.
What asset should a 2008 backtest use?
Many examples use SPY or another broad U.S. equity fund because it has a long public history and represents large-cap U.S. stocks. A more complete analysis can compare U.S. stocks, global stocks, bonds, cash, and custom portfolios.
What is the biggest mistake in a 2008 backtest?
The biggest mistake is choosing the market bottom as the start date and pretending that was obvious in real time. A better backtest tests several start dates, includes drawdown, and compares lump sum, DCA, and hybrid behavior.
Can I simulate my own 2008 investment scenario?
Yes. You can use the WhatIfInvested Investment Simulator for quick historical tests. If you want to compare multiple portfolios, fees, benchmarks, rebalancing, withdrawals, saved scenarios, and PDF reports, use the Premium DCA Calculator.
What did investing in 2008 teach long-term investors?
Investing in 2008 showed that cash reserves, diversification, contribution rules, and emotional discipline matter as much as return forecasts. The investors who benefited most were the ones able to stay invested through uncertainty.
Should a beginner invest during a market crisis?
A beginner should not invest emergency money during a crisis. If the investor has stable cash reserves, a long time horizon, and a diversified plan, gradual investing can be more realistic than trying to time the exact bottom.
How is this different from a DCA-only 2008 article?
This article studies the broader crisis investing decision: lump sum, DCA, hybrid behavior, drawdown, recovery, cash reserves, and simulation discipline. The dedicated DCA article focuses more narrowly on recurring contributions during the 2008 crash.
Practical Checklist Before Investing During Any Future Crisis
A future crisis will not look exactly like 2008. It may come from inflation, rates, geopolitics, technology, credit, or something investors are not currently watching. The details will differ, but the preparation checklist is surprisingly stable.
- Confirm your cash runway. If a job loss or emergency would force you to sell, build cash before adding risk.
- Define your risk budget. Decide how much portfolio decline you can tolerate before the crisis arrives.
- Use a contribution rule. Monthly DCA, quarterly rebalancing, or staged lump sum rules reduce panic decisions.
- Write down what would make you change the plan. Separate real life changes from market noise.
- Review asset concentration. A portfolio dominated by one stock, one sector, or one speculative asset can behave very differently from a broad index.
- Measure recovery time. A high final value is less useful if the investor cannot tolerate years of volatility.
The most durable investors are not fearless. They are prepared. They understand that crashes are part of the long-term investing landscape, and they build systems that make good behavior easier when emotions are loud.
Conclusion: The 2008 Lesson Is Not Just Buy the Dip
The clean hindsight story says that investing during the 2008 crisis was obvious. The real-time story was much harder. Investors had to act while banks were failing, unemployment was rising, portfolios were falling, and the bottom was unknown.
A lump sum during the panic could have produced excellent long-term results if the investor held. A DCA plan could have helped reduce regret and make buying psychologically easier. A hybrid approach could have balanced immediate exposure with continued flexibility. None of these strategies worked without patience.
The best takeaway is practical: build the plan before the crisis. Keep cash for emergencies, choose an allocation you can tolerate, define your contribution rule, and use historical simulations to understand both return and drawdown. A strong crisis strategy is not the one that looks smartest after the fact. It is the one you can actually execute when markets feel broken.