DCA During 2008 Crash: How It Would Have Performed
A practical look at how dollar-cost averaging could have behaved through one of the hardest modern market crashes, compared with lump sum investing, drawdowns, investor psychology, and recovery discipline.
Decision: DCA During a Crash
Dollar-cost averaging would not have prevented losses during the 2008 crisis, but it could have reduced timing regret and helped investors keep buying when markets were falling. That is the real strength of DCA in a crash: it turns fear into a pre-planned contribution schedule.
A lump sum invested before the crash would have participated fully in the decline. DCA during 2008 crash conditions would have deployed money gradually, buying some shares at lower prices during the downturn. The final outcome depends on the exact start date, contribution schedule, fund used, and whether the investor continued through the recovery.
The 2008 Financial Crisis in Investor Terms
The 2008 financial crisis was not a normal correction. It was a global banking and credit crisis that damaged confidence in the financial system itself. Equity markets fell sharply, volatility surged, and many investors questioned whether long-term investing still made sense.
For a regular investor, the hardest part was not reading the economic headlines. It was watching account balances fall month after month while continuing to believe that future contributions still mattered. That is where a rules-based strategy such as DCA can help. DCA during 2008 crash conditions is useful because it shows how a simple buying rule behaves when confidence is low.
| Investor challenge | Why it mattered | DCA response |
|---|---|---|
| Sharp price declines | Immediate losses create fear and regret. | Later contributions buy at lower prices. |
| Uncertain recovery | No one knows the bottom in real time. | Scheduled buys avoid the need to call the bottom. |
| Panic selling | Selling near lows can permanently damage results. | Automation supports discipline. |
| Bad headlines | News can make rational plans feel impossible. | A written plan reduces emotional decisions. |
Why DCA Matters More During Crashes
In calm markets, DCA can feel ordinary. During a crash, it becomes a behavioral system. Every scheduled contribution is a small act of discipline at a moment when many people want to stop. That discipline can matter more than the exact average purchase price.
DCA also changes the emotional framing. Instead of viewing falling prices only as losses, the investor can view them as lower future purchase prices. That does not make the downturn pleasant, but it creates a reason to keep participating.
DCA advantages in a crash
- Reduces the need to pick the bottom.
- Spreads risk across multiple entry points.
- Creates automatic buying when prices are lower.
- Can reduce regret from investing everything too early.
DCA limits in a crash
- It cannot prevent losses.
- It can underperform if the market rebounds quickly before cash is invested.
- It requires the investor to keep buying during fear.
- It still needs a suitable asset allocation.
Simulation Setup: How to Think About the Comparison
The original idea is simple: compare a lump sum invested before or during the crisis with a recurring DCA plan that invests fixed amounts over time. The point is not to claim one exact result for every investor. Different start dates and funds produce different numbers. The point is to understand the mechanism.
A lump sum strategy concentrates entry timing. If the entry is lucky, it can be powerful. If the entry comes before a crash, the investor absorbs the full decline immediately. A DCA strategy spreads entry timing. It may have less upside if markets rise right away, but it can soften the emotional damage of a poor first entry point.
| Strategy | How it enters the market | Main risk | Main strength |
|---|---|---|---|
| Lump Sum | All capital invested immediately | Bad timing before a crash | Maximum time in market |
| DCA | Capital invested in scheduled installments | Cash drag if market rebounds fast | Lower timing regret and smoother entry |
| Hybrid | Part now, part over time | Still imperfect timing | Balances exposure and comfort |
You can test custom dates, assets, and contribution schedules with the Investment Simulator and the DCA Calculator.
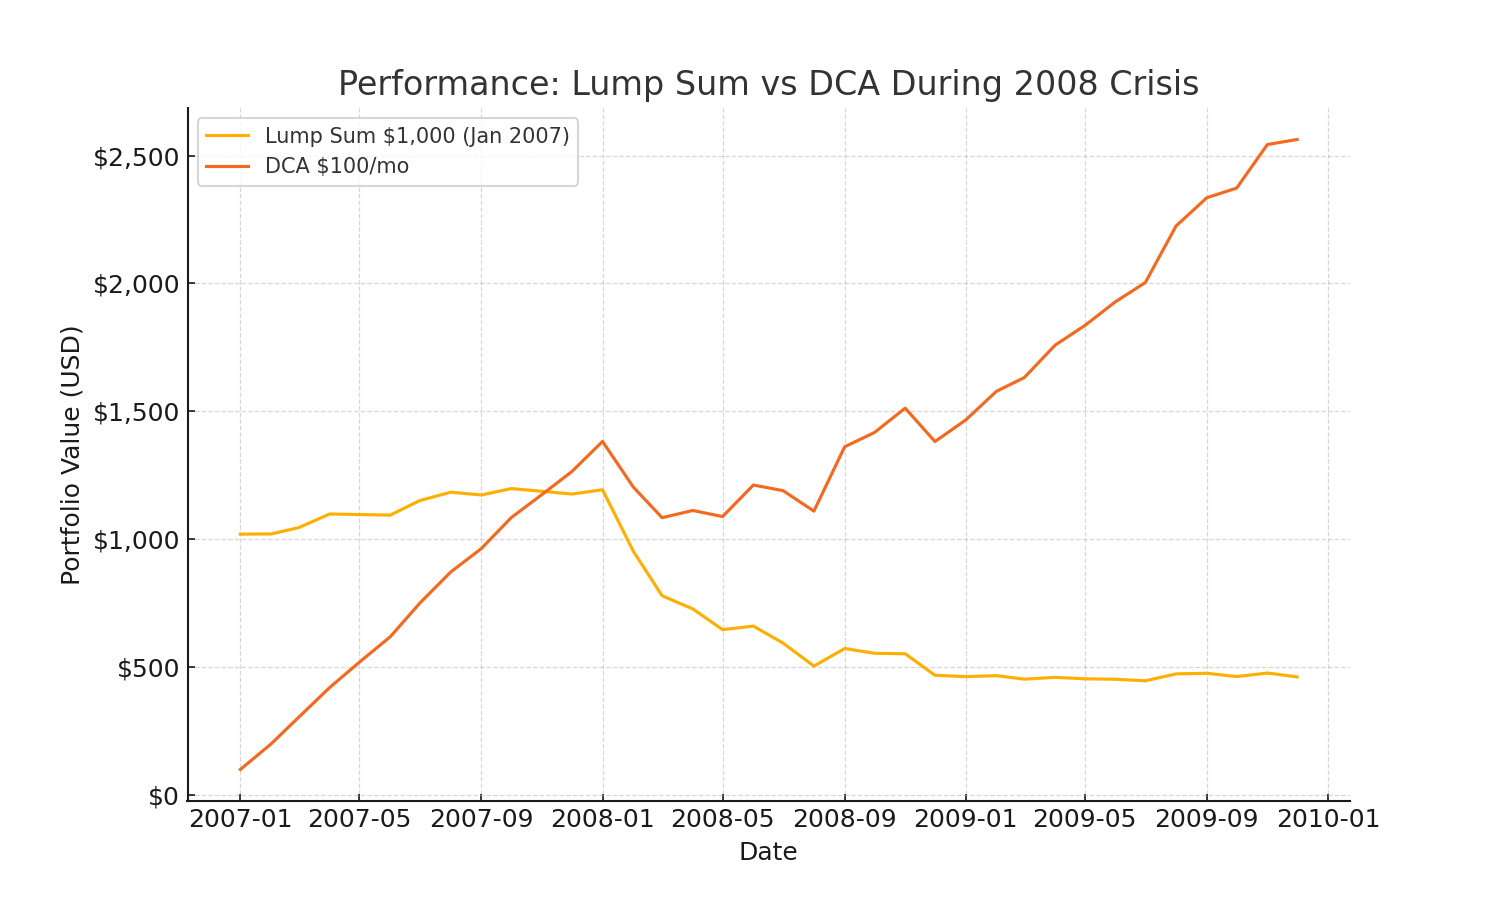
Performance: What DCA Would Have Changed
During a severe decline, DCA changes when capital is exposed. Early contributions may fall, but later contributions purchase more shares at lower prices. This can improve the recovery profile if the investor continues buying through the bottom. In a DCA during 2008 crash comparison, the contribution schedule matters as much as the final chart.
A lump sum investor before the crash may have seen a larger immediate portfolio decline. A DCA investor would have had less capital exposed at the beginning, but would also have been adding money into a falling market. The experience could still feel painful, but the purchase schedule would slowly improve the average entry price.
Drawdown Analysis: The Real Investor Test
Drawdowns are where investing becomes psychological. A 30% or 40% decline is easy to discuss in a chart and hard to live through in real money. Investors do not simply compare final returns. They experience fear, uncertainty, and pressure while losses are happening.
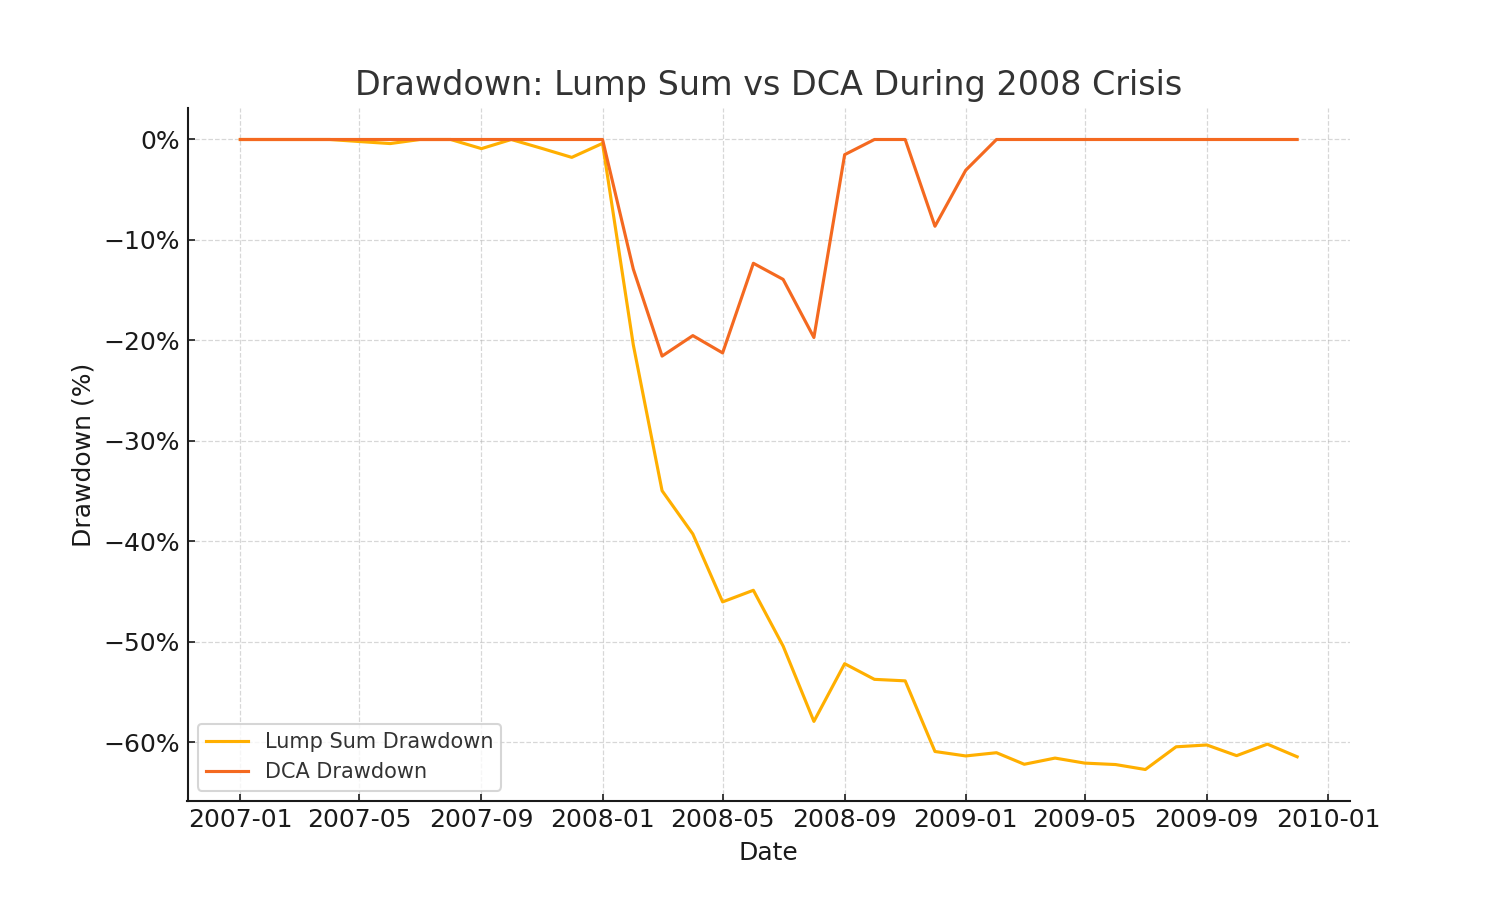
DCA during 2008 crash conditions may reduce the size of the drawdown relative to total planned capital because not all money is invested at the beginning. That can make the strategy easier to continue. The tradeoff is that some money remains in cash and may miss an early recovery if the rebound starts quickly.
Recovery Lessons: Why the Buying Schedule Matters
The recovery phase is where DCA often becomes easier to misunderstand. Many investors focus only on the crash itself, but the real result comes from the full cycle: the decline, the bottoming process, the early rebound, and the later expansion. If an investor stops contributing during the darkest part of the decline, the DCA plan loses the very contributions that would have purchased the most shares.
This is why DCA is not simply a return calculation. It is a commitment mechanism. The investor is agreeing in advance to keep buying across different market conditions. Some purchases will happen before further losses. Some will happen near lower prices. Some will happen after the market has already started recovering. The blended result is less dependent on one perfect entry point.
In a crisis, the first stage of recovery rarely feels safe. Markets can rebound while unemployment is still high, headlines are still negative, and investors still feel uncertain. A rules-based DCA plan can keep the investor participating before confidence returns. That matters because waiting for emotional comfort can mean missing a meaningful part of the rebound. That is why DCA during 2008 crash recovery depends on staying invested after the worst headlines.
| Phase | Investor emotion | DCA advantage | Risk to avoid |
|---|---|---|---|
| Early decline | Regret and surprise | Only part of planned capital may be exposed. | Stopping contributions after the first loss. |
| Deep crisis | Fear and doubt | Scheduled buys can acquire more shares at lower prices. | Trying to wait for perfect clarity. |
| Early recovery | Skepticism | Automation keeps the investor involved. | Assuming the rebound is temporary and staying in cash. |
| Longer recovery | Relief | Earlier low-price purchases begin to matter more. | Changing the plan only after prices recover. |
Behavioral Lessons from 2008
The biggest advantage of DCA during 2008 was behavioral. DCA during 2008 crash fear gave automated investors a rule to follow when emotions were loud. The plan did not require them to decide whether the market was safe. It required them to make the next scheduled contribution.
This matters because many investors fail not from picking the wrong strategy, but from abandoning the strategy at the worst time. A DCA plan can act like a guardrail. It keeps the investor engaged when fear encourages withdrawal.
- Buying low is emotionally hard. DCA makes it mechanical.
- Bad headlines feel persuasive. A written plan gives a counterweight.
- Recoveries start before confidence returns. DCA keeps buying before certainty comes back.
Common Mistakes When Using DCA During a Crash
DCA is simple, but it is not automatic success. The strategy can fail if the investor changes the rules at exactly the wrong time. A crisis makes every mistake feel reasonable in the moment: reducing contributions, waiting for “better news,” switching to cash, or chasing a different asset because it appears to be recovering faster.
The first common mistake is treating DCA like a market-timing tool. DCA during 2008 crash history is not a promise that every purchase will be better than the last one. Markets can fall after several contributions in a row. That does not mean the strategy is broken. It means the investor is living through the exact environment where discipline matters.
The second mistake is using DCA with money that should not be invested. If the cash is needed for rent, taxes, emergency reserves, or a near-term purchase, a crash can turn a normal market decline into a personal finance problem. DCA works best when the investor has a separate emergency fund and a long enough time horizon to let the strategy play out.
The third mistake is increasing risk because prices are down. Buying broad, diversified funds on a schedule is very different from doubling down on a fragile company, a narrow sector, or a speculative asset. A crash can create opportunity, but it can also expose weak businesses and risky portfolios. The investment vehicle still matters.
Good DCA discipline
- Keep the schedule simple and pre-written.
- Use cash flow that is truly available for investing.
- Prefer diversified assets for recurring contributions.
- Review the plan monthly or quarterly, not every hour.
Danger signs
- Stopping after several down months.
- Changing assets because of short-term headlines.
- Using emergency cash to buy the dip.
- Checking the portfolio so often that panic takes over.
A strong DCA plan should feel almost boring. The investor knows what will be bought, when it will be bought, and which money is being used. That boring structure is exactly what helps when the market environment becomes loud and emotional.
How Lump Sum Could Still Win
It is tempting to conclude that DCA always wins during crashes, but that is not true. A lump sum invested after a large decline can be extremely powerful. If an investor has the discipline and luck to invest near the bottom, lump sum may dominate DCA because all capital participates in the rebound.
The challenge is that real investors do not know the bottom when they are living through it. In March 2009, the future was not obvious. It felt risky to buy. Many investors were still afraid. This is the main tension in any DCA during 2008 crash comparison: the best mathematical answer is not always the easiest human answer to execute. DCA is useful precisely because it does not require perfect courage on a single day.
| Question | If yes | If no |
|---|---|---|
| Can you tolerate a large immediate loss? | Lump sum may fit. | DCA or hybrid may fit better. |
| Do you know your long-term allocation? | Investing sooner is easier. | Use DCA while finalizing the plan. |
| Would you stop investing during a crash? | Automate DCA. | Lump sum may be manageable. |
| Is the money needed soon? | Do not invest it aggressively. | Long-term investing can be considered. |
Which Investor Benefits Most from DCA in a Crash?
DCA is most useful for investors who have ongoing income, a long time horizon, and enough discipline to keep contributing when markets look terrible. It is also useful for someone investing a large windfall who knows they would regret putting everything in right before a drop. DCA during 2008 crash scenarios are especially relevant for investors who can automate contributions and avoid reacting to every headline.
Good fit for DCA
- Monthly saver investing from paychecks.
- Nervous investor with a large cash position.
- Investor who wants a written schedule.
- Retirement saver with decades ahead.
Less ideal for DCA
- Investor who keeps delaying every installment.
- Short-term saver who needs cash soon.
- Investor using a very speculative asset.
- Someone who will not automate or follow rules.
For ETF-focused investors, the next step is choosing what to buy. The guide on Top ETFs for Monthly DCA connects contribution strategy with fund selection.
A Practical Crash DCA Playbook
- Keep emergency cash separate. Do not invest money needed for rent, taxes, debt payments, or near-term goals.
- Choose the account first. TFSA, RRSP, FHSA, IRA, 401(k), or taxable account can change the result.
- Set the schedule before fear hits. Decide the contribution amount and dates in advance.
- Use diversified investments. Broad ETFs are usually better DCA candidates than single speculative names.
- Do not pause near the bottom. The hardest contributions may be the most important.
- Review only on schedule. Constant checking can turn a good plan into emotional trading.
How DCA During a Market Crash Differs from Normal DCA
DCA during 2008 crash history is useful as a case study, but the broader lesson applies to other market crashes too. A normal DCA plan is mostly about building wealth from income. A crash DCA plan is about continuing that process when prices are falling, headlines are scary, and the investor has a strong temptation to wait for certainty.
The difference is not just volatility. In normal markets, an investor might barely notice each contribution. During a crash, every scheduled purchase feels like a decision. The investor may wonder whether the financial system is broken, whether the market will keep falling, or whether buying more is irresponsible. That is why a crash DCA plan needs rules before the crash begins.
A strong plan answers four questions in advance: how much will be invested, how often it will be invested, which asset or portfolio will receive the contribution, and what conditions would justify stopping. Without those rules, DCA can become emotional market timing with a calmer name.
| Market environment | What the investor feels | What DCA should do | Main risk |
|---|---|---|---|
| Normal growth market | Routine and optimism | Build exposure gradually from income. | Underinvesting because cash waits too long. |
| Fast correction | Regret and hesitation | Keep the scheduled purchase rule intact. | Pausing after the first sharp drop. |
| Deep crash | Fear and disbelief | Use the plan to keep buying lower prices. | Changing strategy near the bottom. |
| Early recovery | Skepticism and caution | Stay invested before confidence returns. | Waiting until the rebound is obvious. |
The reason 2008 is such a strong example is that it combined market losses with deep uncertainty. Investors were not simply reacting to a chart. They were reacting to bank failures, unemployment risk, housing stress, and daily headlines about systemic damage. In that environment, DCA during 2008 crash volatility would have helped most if it was connected to cash flow the investor could truly afford to invest.
This is also why DCA should not be treated as a guarantee. If the selected investment is too concentrated, too speculative, or permanently impaired, recurring purchases can simply add more money to a weak asset. The best DCA candidates during crashes are usually broad, diversified holdings that the investor would still want to own after the crisis ends.
For a more general historical crash scenario, read What If You Invested During the 2008 Crisis?. For a SPY-specific recovery angle, read SPY Crash Recovery. This page should remain focused on DCA during 2008 crash behavior and the contribution schedule inside the crisis.
How to Test Your Own Crash DCA Plan
The best next step is not to memorize one 2008 result. It is to test a plan that matches your actual cash flow. A monthly saver, a lump sum investor, and a hybrid investor do not experience the same crash. The numbers can look different even when the asset is the same.
Start with the DCA Calculator if your main question is contribution behavior: monthly amount, frequency, time horizon, and expected long-term growth. Use it to understand how recurring deposits compound and how much of the final result comes from contributions versus growth.
Then use the Investment Simulator if your question is historical: what would have happened if the plan started before the crash, during the crash, or near the recovery? The simulator is better for comparing actual historical windows, while the calculator is better for planning repeatable contribution habits.
DCA during 2008 crash analysis is most useful when it becomes interactive. When the question becomes more advanced, Premium planning access becomes more relevant. Premium value appears when you need to compare weighted portfolios, include fees, test rebalancing, model withdrawals, save scenarios, or export a report. Those features matter more when the decision is not simply “DCA or not,” but “which plan can I actually follow through a bad market?”
Use the free workflow when
- You want to compare DCA and lump sum quickly.
- You are testing one broad ETF or asset at a time.
- You want to understand drawdown and recovery behavior.
- You need a simple answer before building a full plan.
Use the Premium workflow when
- You are comparing multiple portfolios or allocations.
- You need scenario notes, exports, or repeatable reports.
- You want to include fees, rebalancing, or withdrawals.
- You are using the result to support a serious investing decision.
If you are unsure which tool fits, the All Calculators hub helps route the decision. If you want the broader strategy comparison before testing numbers, read DCA vs Lump Sum and the guide to best dollar-cost averaging strategies.
When to Choose DCA, Lump Sum, or a Hybrid During a Crisis
The practical decision is not always “which method has the highest historical return?” A better question is which method gives the investor the best chance of staying invested. A person with a stable job, a full emergency fund, and a strong stomach may be comfortable investing a lump sum after a major selloff. A person who would panic after a large first-month loss may be better served by DCA or a hybrid approach.
A hybrid approach can be useful when the investor wants market exposure but also wants emotional protection. For example, an investor could place part of the cash immediately and spread the rest over six or twelve months. That approach will not be perfect, but it can reduce regret in both directions: regret from waiting too long if markets rebound, and regret from investing everything right before another decline.
The key is to decide before the next crisis. Waiting until markets are already falling makes the decision harder. A written plan can say: if cash is available for long-term investing, invest a fixed amount each month; if markets fall further, continue the same schedule; if income becomes unstable, pause only after protecting emergency reserves. That kind of rule is more useful than trying to predict the next bottom.
Frequently Asked Questions
Would DCA have made money during the 2008 crash?
It depends on the exact start date, asset, schedule, and end date. DCA would not have avoided losses during the crash, but continuing contributions through the bottom could improve the recovery profile.
Did DCA beat lump sum during the 2008 crisis?
Sometimes, depending on timing. A lump sum invested before the crash suffered the full decline. A lump sum invested near the bottom would likely beat a slow DCA plan.
Is DCA safer than lump sum?
DCA can reduce timing risk and emotional pressure, but it does not remove market risk. The portfolio can still fall significantly.
Should I keep investing during a crash?
If your emergency fund is secure, your time horizon is long, and your asset allocation is appropriate, continuing a planned contribution schedule can be reasonable.
What is the biggest DCA mistake during a crash?
The biggest mistake is stopping the plan after prices fall. DCA’s main benefit comes from continuing to buy through difficult periods.
Can I use DCA with ETFs?
Yes. Broad, low-cost ETFs are common DCA vehicles because they offer diversification and are easy to buy regularly.
How can I backtest DCA during a market crash?
Use a historical simulator to choose a start date, asset, contribution amount, and contribution frequency, then compare the DCA result with lump sum and hybrid alternatives.
Is DCA during a crash better for beginners?
It can be easier for beginners because the plan removes the pressure to choose one perfect entry date, but beginners still need emergency savings, diversification, and a long enough time horizon.
Trusted External Resources
These resources provide additional background on DCA and long-term investing behavior: