💼📉 XBB vs VAB vs ZAG (2025 Comparison)
Primary keyword: XBB vs VAB vs ZAG • Type: ETF Comparison • Updated:
For Canadian investors in 2025, XBB (iShares Core Canadian Universe Bond Index ETF), VAB (Vanguard Canadian Aggregate Bond Index ETF), and ZAG (BMO Aggregate Bond Index ETF) stand out as the most popular “core” bond holdings. Each of these ETFs offers broad, investment-grade fixed income exposure across federal, provincial/municipal, and corporate bonds, typically with monthly interest distributions that appeal to income-focused investors.
On the surface, they may seem almost identical — all three track a Canadian aggregate bond index, maintain high credit quality, and provide diversification across hundreds of issuers. However, subtle differences in Management Expense Ratio (MER), effective duration, index methodology, tracking error, assets under management (AUM), and even small compositional tilts can influence long-term performance and risk profile.
This comprehensive XBB vs VAB vs ZAG comparison will walk you through how these ETFs differ, highlight key data points you should consider before buying, and help you determine which one might be the right anchor for your fixed-income allocation based on your investment horizon, risk tolerance, and cash-flow needs. Whether you’re seeking stability in volatile markets or steady income for retirement, understanding these differences can make a measurable impact on your returns.
Power up your analysis with our free and premium tools:
- DCA Calculator — see how steady contributions smooth volatility.
- Investment Simulator — backtest XBB, VAB, ZAG across different start dates.
- Premium — advanced setups: rebalancing, fee modeling, multi‑portfolio, exports.
- WhatIfBudget — plan monthly contributions and emergency buffers.
🧾 Quick ETF Profiles (2025)
Before diving into performance metrics, it’s important to understand what each ETF actually holds and how it’s structured. While XBB, VAB, and ZAG all provide broad exposure to the Canadian investment-grade bond market, there are subtle differences in index tracking, cost structure, and portfolio composition that may influence your choice.
XBB — iShares Core Canadian Universe Bond Index ETF Tracks the FTSE Canada Universe Bond Index, covering federal, provincial, and corporate bonds. As of mid-2025, its MER is around 0.10%, with an effective duration of approximately 7.1 years and a yield to maturity (YTM) near 3.5%. It boasts one of the largest Assets Under Management (AUM) in the category, providing strong liquidity and tight bid-ask spreads. Distributions are paid monthly.
VAB — Vanguard Canadian Aggregate Bond Index ETF Replicates the Bloomberg Global Aggregate Canadian Float Adjusted Bond Index, a slightly different benchmark methodology. MER is competitive at 0.09%, with an average duration of around 7.2 years and a YTM of about 3.5%. Vanguard’s scale ensures consistent tracking performance and low tracking error. Distributions are also monthly.
ZAG — BMO Aggregate Bond Index ETF Tracks the same FTSE Canada Universe Bond Index as XBB but applies BMO’s own index-replication approach. MER is around 0.09%, with one of the largest AUM in the category. Its duration is typically close to 7 years, offering similar interest-rate sensitivity to its peers. Monthly distributions are standard.
📌 Tip: Always verify the latest data directly on the ETF provider’s official factsheet before making investment decisions — MER, duration, YTM, and AUM can change over time due to market movements or fund rebalancing.
📊 XBB vs VAB vs ZAG — At-a-Glance Comparison (2025)
The table below summarizes the key facts for XBB, VAB, and ZAG as of mid-2025. These figures provide a quick snapshot of costs, interest-rate sensitivity, and income potential — all important factors when selecting a core Canadian bond ETF for your portfolio.
| ETF | Index | MER | Effective Duration | YTM (approx.) | AUM (approx.) | Distribution Frequency |
|---|---|---|---|---|---|---|
| XBB | FTSE Canada Universe | 0.10% | ~7.1y | ~3.5% | Large | Monthly |
| VAB | Bloomberg Agg Canada Float-Adj | 0.09% | ~7.2y | ~3.5% | Large | Monthly |
| ZAG | FTSE Canada Universe | 0.09% | ~7.1–7.2y | ~3.5% | Large | Monthly |
Both XBB and ZAG track the FTSE Canada Universe Bond Index, which includes federal, provincial, and investment-grade corporate bonds across a wide maturity spectrum. This makes them nearly identical in portfolio composition, with differences largely limited to provider execution and MER. VAB, on the other hand, follows Bloomberg’s float-adjusted Canadian aggregate index. This methodology excludes certain government bonds held by the Bank of Canada, which slightly alters the weightings and can lead to small differences in yield, duration, and performance over time.
Always confirm the latest fund factsheets before investing — MER, duration, and YTM may shift with market conditions and index rebalancing.
💸 Fees (MER): Small Differences That Compound Over Time

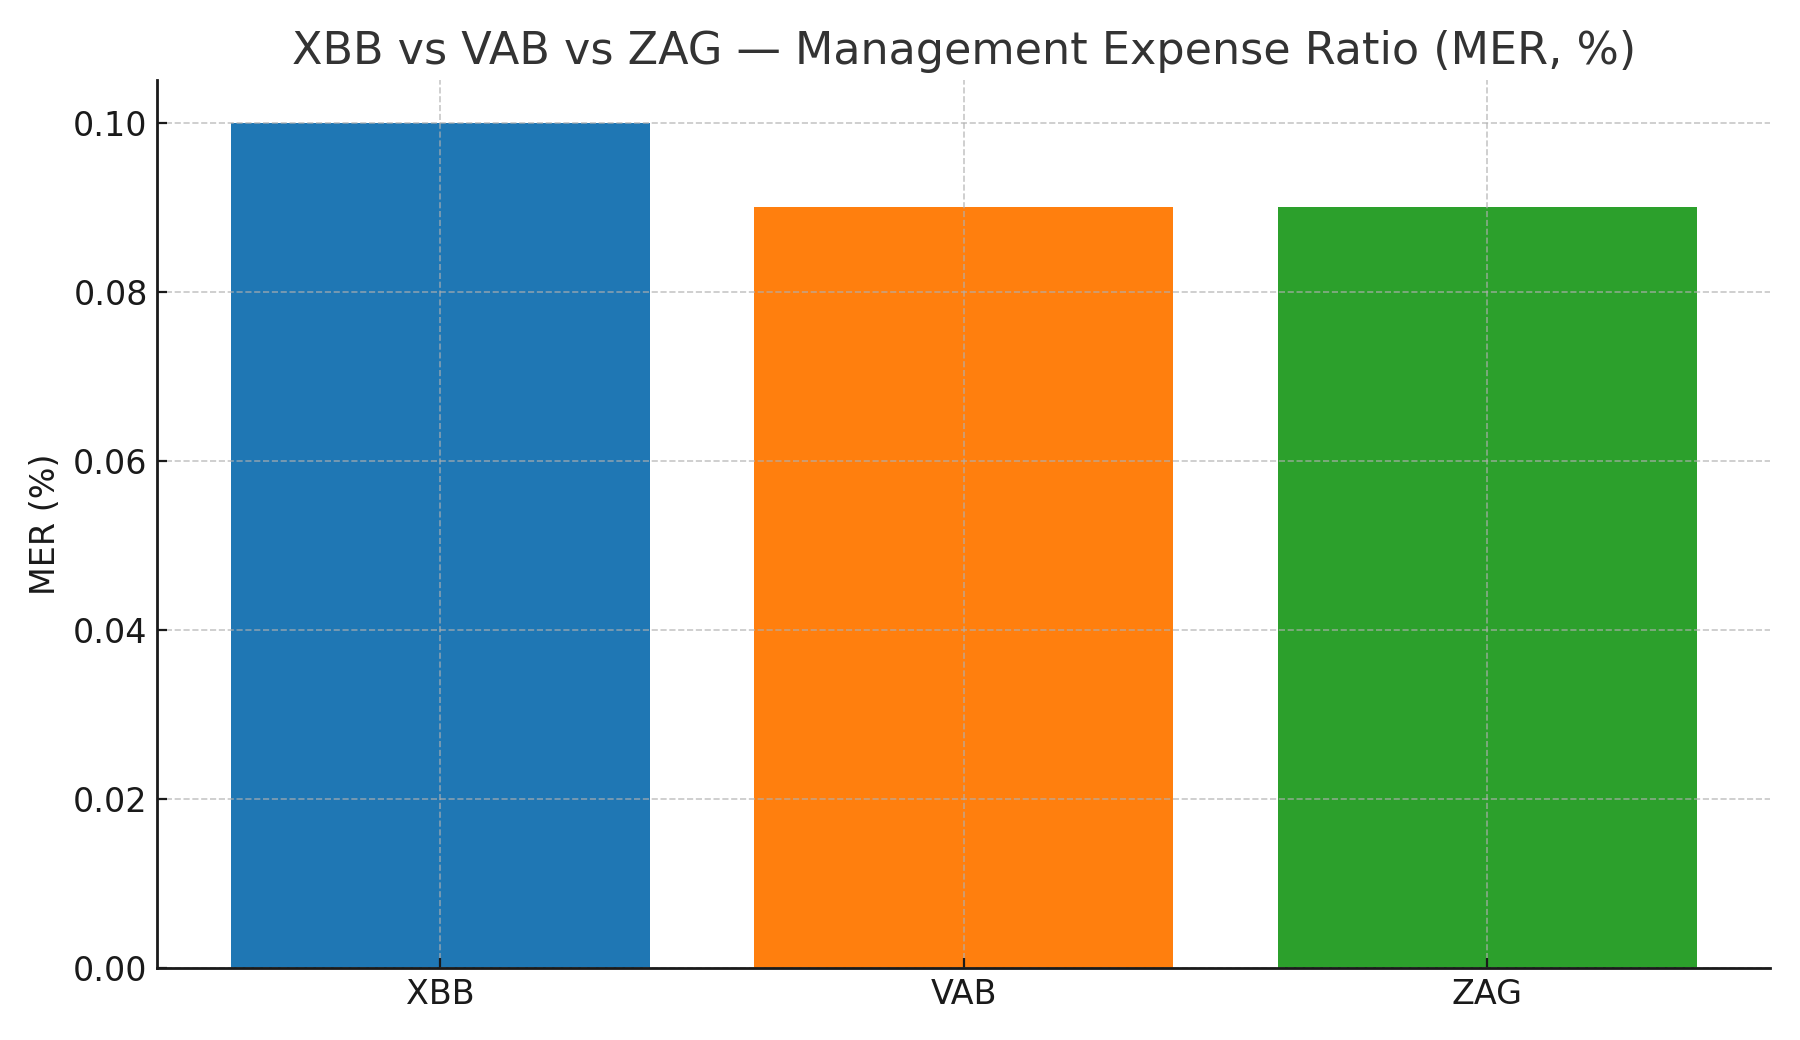
At first glance, a 0.10% MER for XBB compared to 0.09% for VAB and ZAG might look negligible. However, over a 10–20 year investment horizon, that 0.01% annual difference quietly compounds into a meaningful sum — especially on larger portfolios. In situations where two ETFs offer nearly identical exposure, the one with the lower MER will generally provide a small but consistent performance edge over time.
That said, MER is only one part of the cost equation. Realized returns can also be influenced by:
- Tracking difference — the gap between the ETF’s performance and its benchmark index.
- Replication method — full replication vs. sampling can impact precision and costs.
- Cash drag — idle cash in the fund that’s not invested can slightly reduce returns.
- Securities lending revenue — can offset costs, depending on the provider’s policy.
- Liquidity and spreads — tighter bid–ask spreads reduce transaction costs for investors.
A practical tie-breaker when MERs are close is to review long-term tracking data and liquidity on your brokerage platform. This ensures you’re not just choosing the lowest headline fee, but the ETF that delivers the most consistent net-of-fee returns.
📈 Historical Performance — 10-Year Total Return

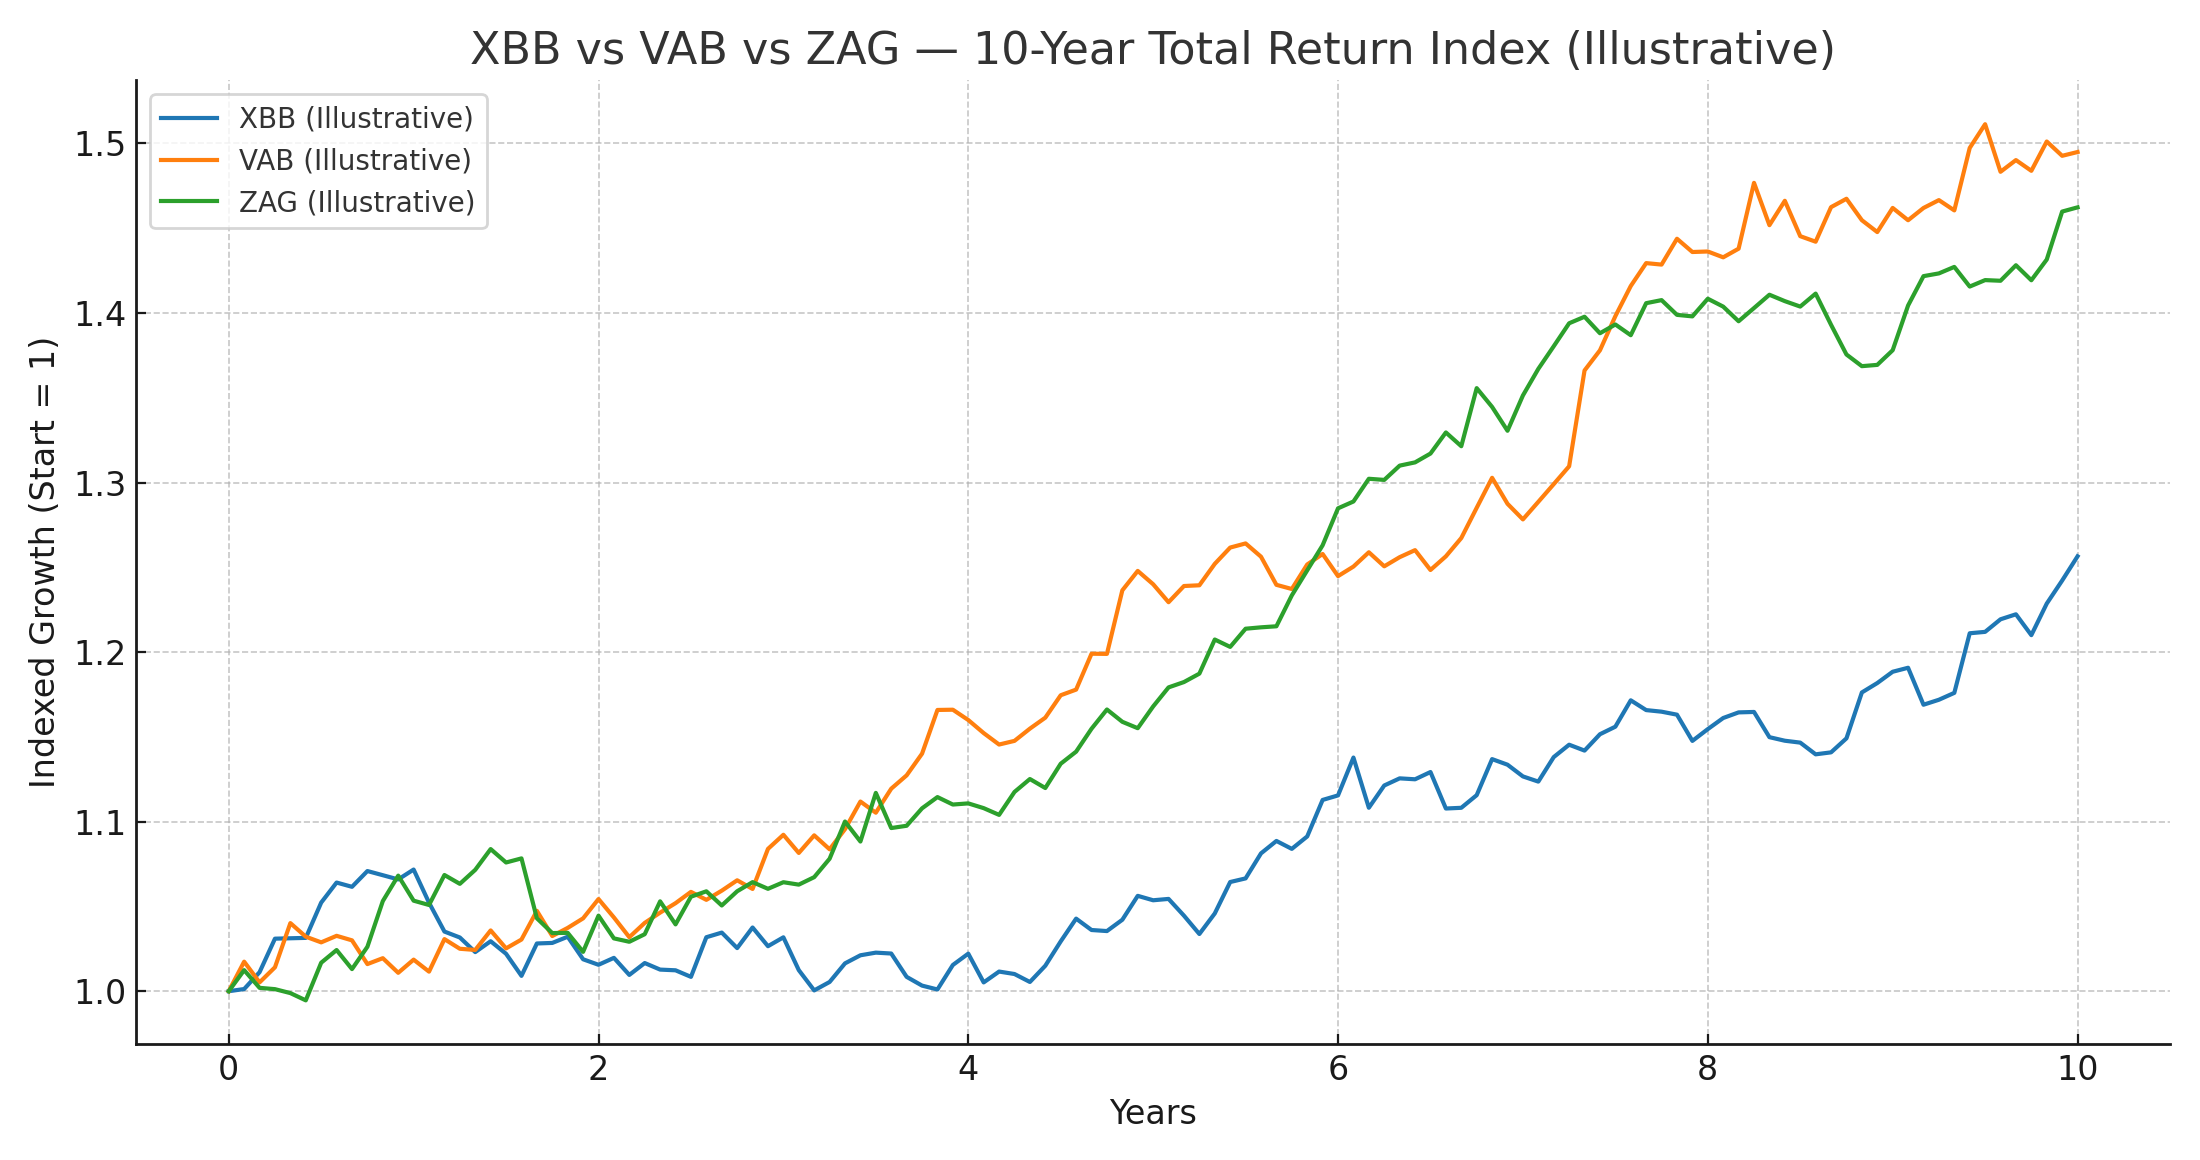
Over the past decade, XBB, VAB, and ZAG have delivered remarkably similar total returns, reflecting their shared exposure to the Canadian investment-grade bond market. All three ETFs provide steady income and portfolio stability, but like all fixed income, they are sensitive to macroeconomic forces.
For example, the 2021–2022 interest rate surge — the sharpest in decades — weighed heavily on medium-duration bonds, resulting in negative returns for the first time in years. Conversely, periods of rate stabilization or expectations of rate cuts have historically boosted aggregate bond prices, providing positive total returns.
When evaluating performance, it’s critical to look at total return — which includes both price changes and reinvested distributions — rather than just the market price. Over a long investment horizon, the small performance differences between these three ETFs are largely explained by:
- Index methodology (FTSE Canada Universe vs. Bloomberg Aggregate Float-Adjusted)
- Management Expense Ratio (MER) differences
- Minor tracking error and portfolio implementation choices
For most investors, these differences are modest, and the choice between XBB, VAB, and ZAG will come down to costs, tracking history, and personal provider preference rather than raw past performance.
⏱️ Duration & Interest-Rate Sensitivity

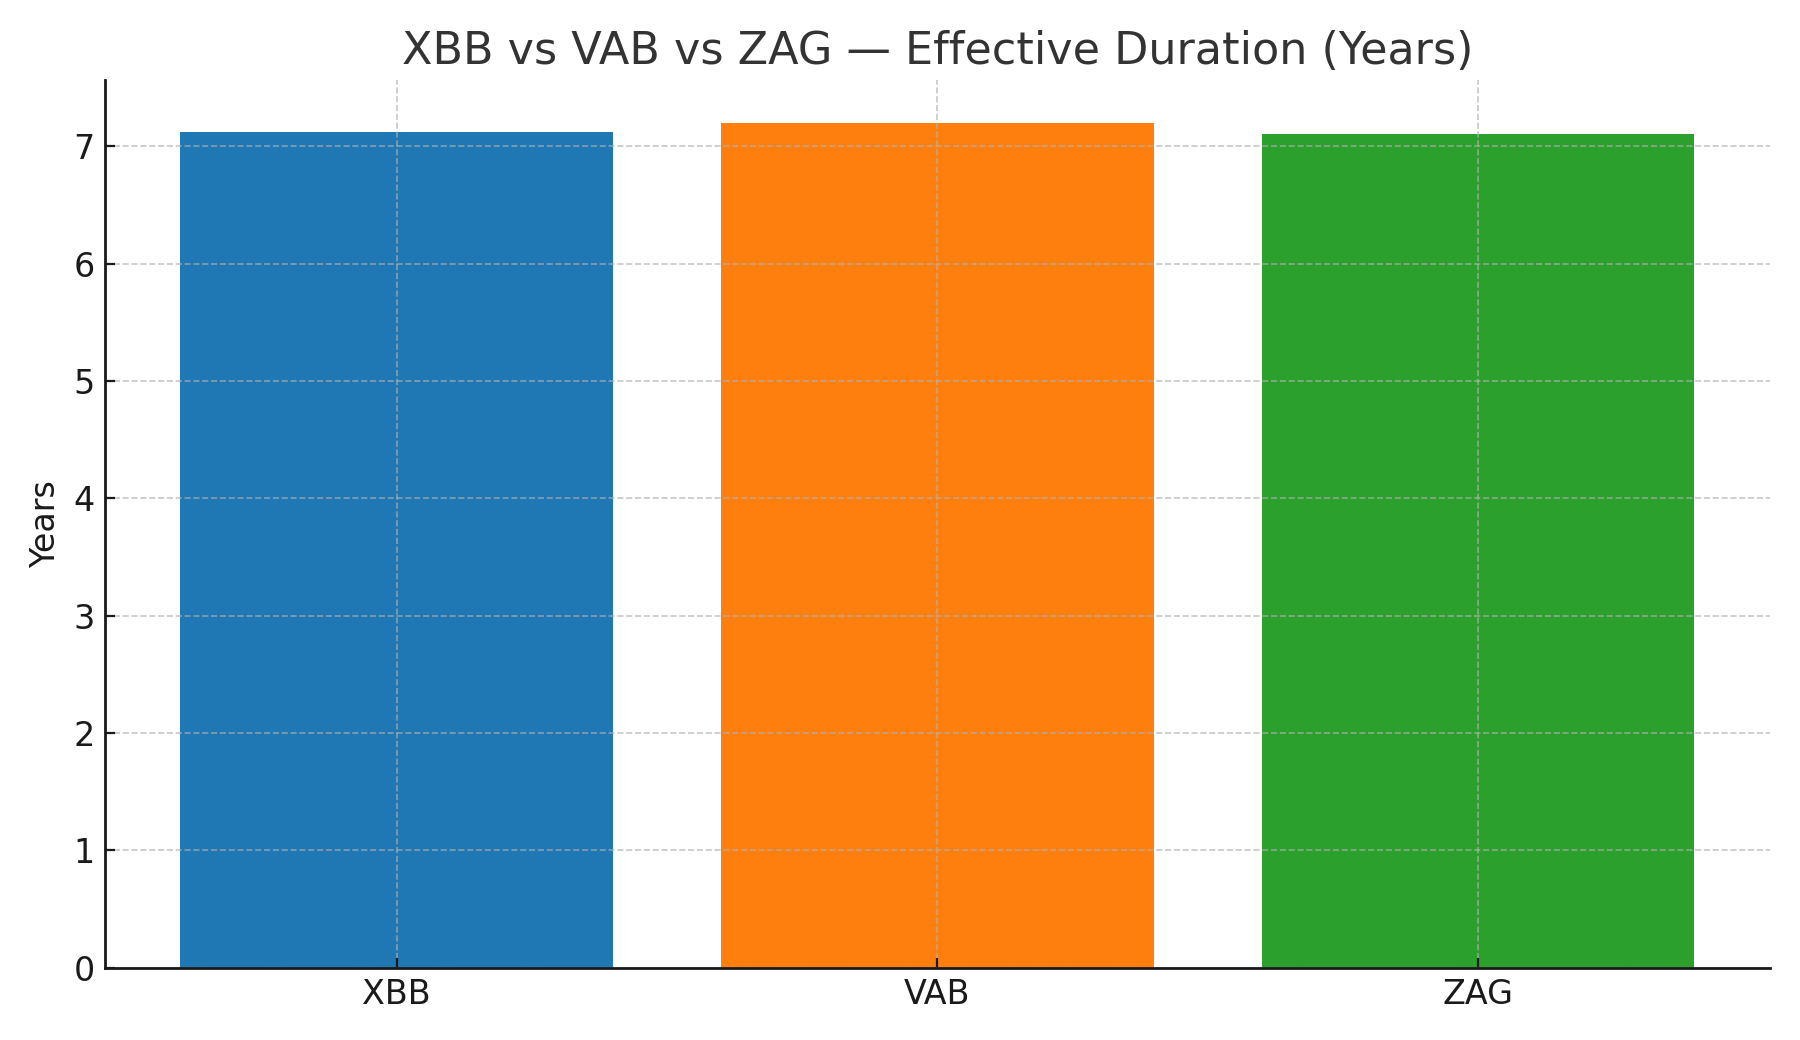
Effective duration for XBB, VAB, and ZAG hovers around 7 years, which means they all respond in a broadly similar way to interest rate movements. Using the duration rule of thumb, a 1% increase in yields would be expected to reduce the ETF’s price by roughly 7%, while a 1% decrease could boost it by a similar amount — before accounting for coupon income.
Duration essentially measures a bond portfolio’s interest-rate risk. A higher duration means more sensitivity to rate changes, which can amplify both gains and losses in volatile rate environments. For most long-term investors, a “core aggregate” duration in the 6–8 year range is considered balanced: it provides income stability while still offering moderate upside in falling rate scenarios.
If your goal is to reduce rate sensitivity, you can blend your core bond ETF with short-term bonds or GICs. Conversely, if you want to increase your exposure to rate changes, you can tilt towards longer-duration ETFs or add long government bond exposure. Either way, ensure you maintain a sufficient cash buffer and rebalance periodically to keep your risk profile in check.
🏗️ Composition & Credit Quality

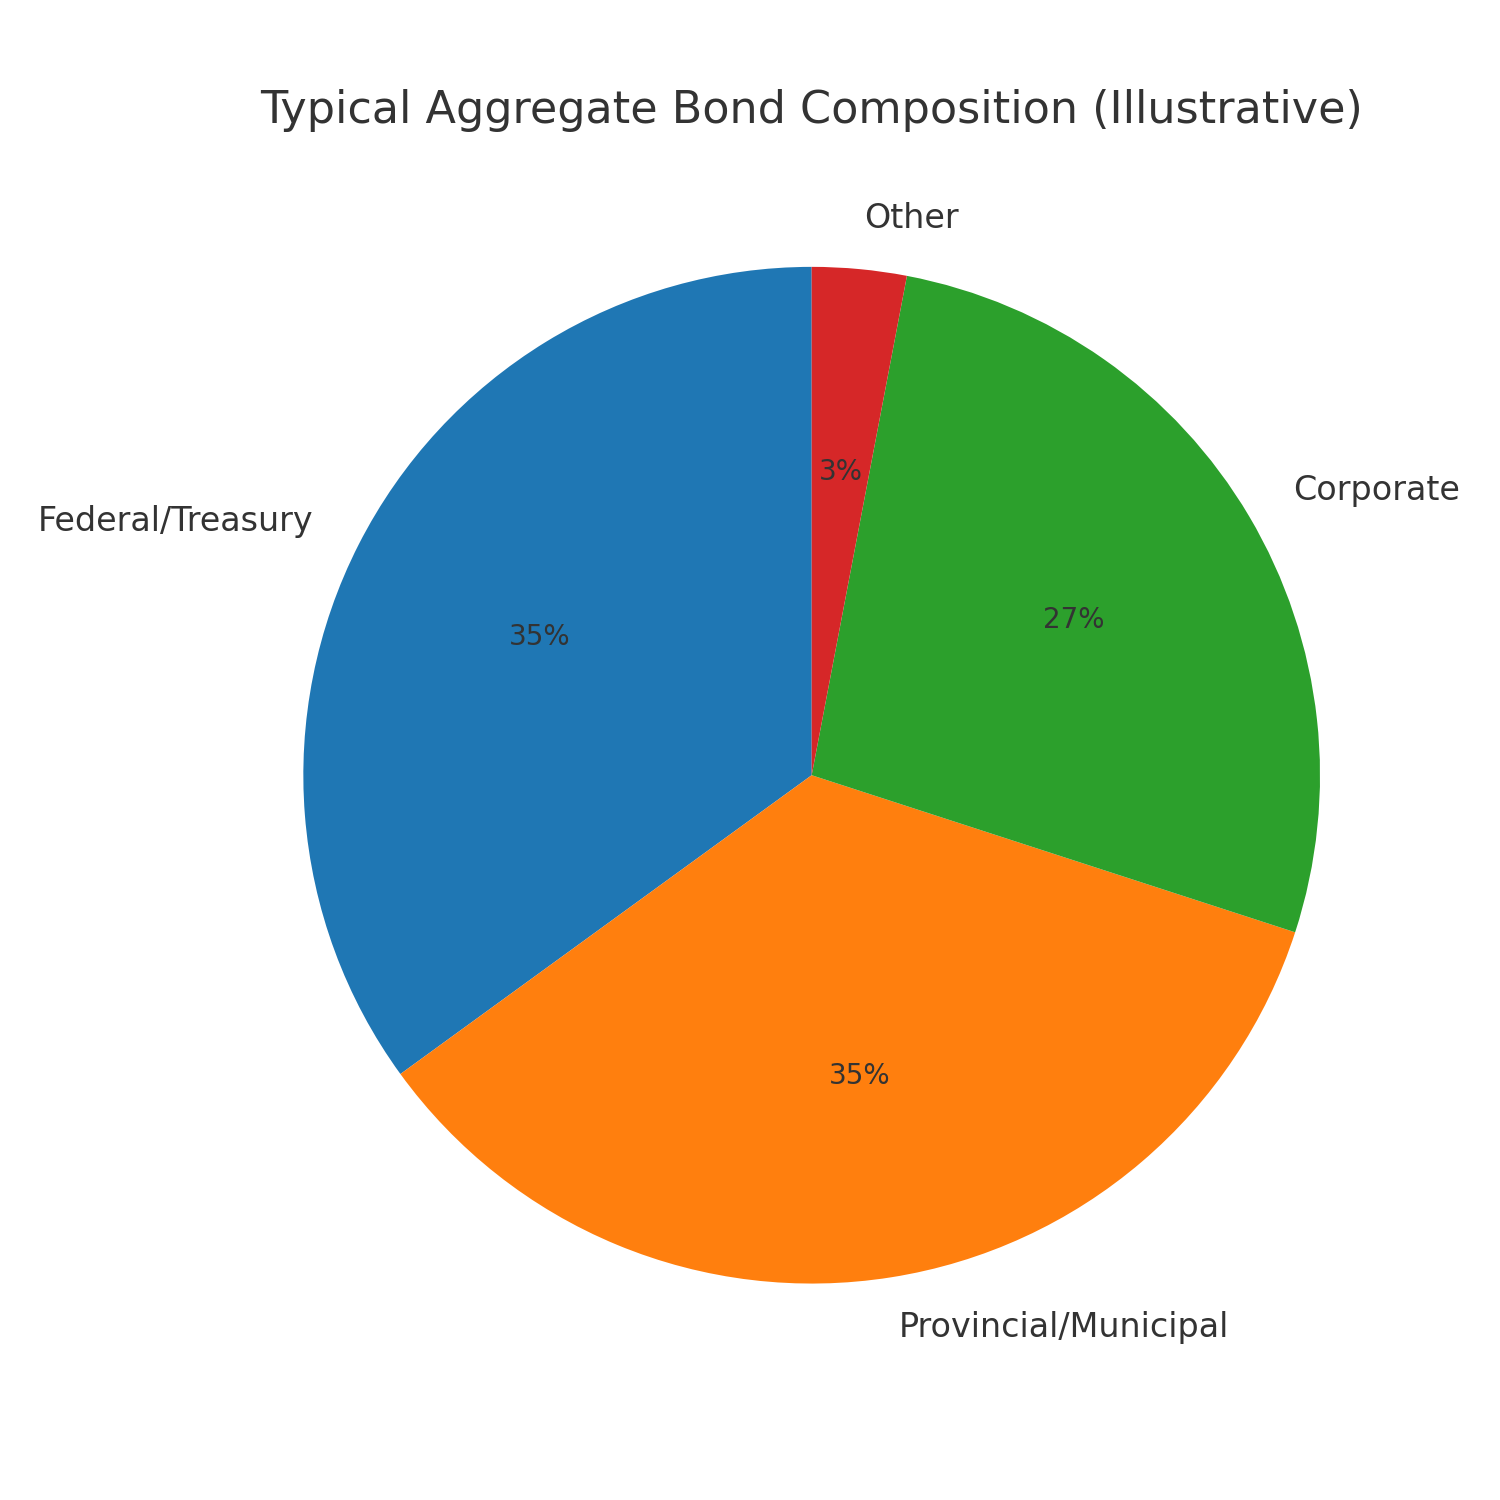
The portfolios of XBB, VAB, and ZAG share a similar high-quality structure, dominated by Government of Canada bonds and provincial/municipal issues. These sovereign-backed securities provide a strong credit foundation and tend to hold up better during periods of market stress.
Each ETF also includes a corporate bond allocation — typically in the 20–30% range — to enhance yield. While these bonds are investment grade, they do introduce spread risk, meaning their prices can fall faster than government bonds during economic slowdowns or credit market stress.
Index methodology creates subtle but persistent differences in sector weights. XBB and ZAG track the FTSE Canada Universe Bond Index, while VAB follows the Bloomberg Global Aggregate Canadian Float-Adjusted Bond Index. These benchmarks are similar, but Bloomberg’s float-adjusted approach slightly alters weightings for certain issuers and sectors. For most investors, the difference is minimal — but for purists and institutional portfolios, index choice can matter.
Overall, all three ETFs offer a balanced credit profile with moderate risk, steady income potential, and strong diversification across government and corporate issuers.
🧭 2025 Scenarios: Inflation, Growth, and Interest Rate Paths
In 2025, central banks face the delicate balancing act of guiding economies through a phase of disinflation while avoiding a significant slowdown in growth. For investors, XBB, VAB, and ZAG remain valuable “shock absorbers” in diversified portfolios — but their effectiveness will depend on how inflation and interest rates evolve.
If interest rates decline due to slower economic growth or easing inflation, the ~7-year duration of these ETFs could provide a meaningful capital gains tailwind, on top of steady income from coupon payments. Conversely, if inflation reaccelerates and central banks resume tightening, bond prices would face headwinds and returns could turn negative in the short term.
The practical takeaway is allocation discipline:
- Match your fixed-income exposure to your investment horizon and liquidity needs.
- Consider your behavioral tolerance for drawdowns — even bonds can lose value in rising rate cycles.
- Automate contributions to reduce timing risk and smooth entry points.
- Rebalance periodically to maintain your target asset mix.
While no one can predict the exact path of rates or inflation, disciplined investors who size their bond allocations appropriately and remain consistent are more likely to capture the long-term benefits of holding core fixed income.
🧩 Which ETF Fits Which Investor?
While XBB, VAB, and ZAG all serve as solid “core” Canadian bond holdings, small differences can tilt the balance depending on your goals, costs, and comfort with credit risk.
- Classic passive core: VAB and ZAG both offer a 0.09% MER, while XBB sits slightly higher at 0.10% but provides exceptional liquidity and one of the longest live track records. Choose based on brokerage spreads, brand preference, and long-term tracking data.
- Fee optimizer: Over decades, a 0.01% MER gap can add up, especially on large portfolios. All else equal, the lower MER wins — but always check tracking difference and real-world trading costs before deciding.
- Credit-risk averse: All three are “aggregate” ETFs, meaning they include investment-grade corporates. If you want maximum defense during market stress, consider pairing one of these with a pure government bond ETF for extra credit protection.
🔄 DCA vs. Lump Sum for Bond ETFs
Dollar-Cost Averaging (DCA) helps you stay disciplined during uncertain markets. By investing a fixed amount at regular intervals, you reduce the risk of going “all-in” at the wrong time and align your purchases with your real-life cash flow. This can be especially helpful when bond yields and rates are volatile.
In periods of sharp rate declines, a lump-sum investment may produce higher short-term gains — but perfectly timing those opportunities is rare even for professionals. For most investors, DCA provides a smoother emotional ride and removes the temptation to guess market turns.
You can plan and test your approach using our free tools: WhatIfBudget helps you schedule contributions, while the Investment Simulator lets you backtest start dates and different market paths. For advanced scenarios — such as managing multiple portfolios, applying rebalancing bands, and modeling portfolio fees — upgrade to Premium.
🧱 Portfolio Fit: 60/40, 80/20, and Variations
In a classic 60/40 portfolio, a Canadian aggregate bond ETF such as XBB, VAB, or ZAG forms a natural “core” bond sleeve. These ETFs provide diversified exposure to federal, provincial, and investment-grade corporate bonds, helping to stabilize returns when equities fluctuate.
Many investors adapt this base by pairing their aggregate ETF with short-term bonds to reduce duration risk, or by adding a global CAD-hedged bond ETF for broader sovereign diversification. When mixing funds, watch for overlap: XBB and ZAG both track the FTSE Canada Universe Index, while VAB follows Bloomberg’s float-adjusted Canadian Aggregate Index — close cousins rather than twins.
🛠️ Use Our Tools to Model Your Plan
Building the right bond allocation is easier with the right data. Our free and premium tools help you model different contribution schedules, simulate market scenarios, and compare ETF choices like XBB vs VAB vs ZAG with precision.
- WhatIfBudget — plan monthly contributions and maintain a cash buffer.
- DCA Calculator — visualize average cost per unit vs. market path.
- Investment Simulator — backtest XBB/VAB/ZAG performance with rebalancing rules.
- Premium — advanced scenarios, data exports, and multi-portfolio setups.
Open an investing account (affiliate): Wealthsimple
Recommended books (Amazon affiliate): The Intelligent Investor, The Psychology of Money
🔗 Keep Learning
Continue improving your investing strategy with these related guides and comparisons:
📚 References
- Investopedia: Bond Duration — clear primer on duration math and rate sensitivity.
- Bogleheads Wiki: Three‑fund portfolio — framework for building a simple, diversified portfolio with a bond core.
- Official ETF pages/factsheets: always verify the latest MER, AUM, duration, YTM, and holdings:
- BlackRock iShares — XBB (Core Canadian Universe Bond Index ETF)
- Vanguard Canada — VAB (Canadian Aggregate Bond Index ETF)
- BMO ETFs — ZAG (Aggregate Bond Index ETF)
❓ FAQ
Are XBB, VAB, and ZAG interchangeable?
They all target Canadian investment‑grade aggregate bonds. Differences (FTSE vs Bloomberg indices, MER, AUM, minor implementation choices) create small tracking spreads. For a passive core, they’re broadly substitutable.
Which one has the lowest fee?
In 2025, VAB and ZAG commonly show a 0.09% MER; XBB often lists 0.10%. It’s a tiny gap but compounds over decades — still verify current factsheets.
How do I reduce rate sensitivity?
Blend in short‑term bonds (lower duration), use DCA to avoid timing mistakes, and rebalance. Core aggregates hover around ~7‑year duration — plan your cash buffer accordingly.
What about tracking error and liquidity?
When MERs are close, real‑world differences can come from tracking error, cash drag, and trading costs. Check long‑term tracking history and average bid‑ask spreads on your brokerage before deciding.
Where should I hold these ETFs for tax efficiency?
Many investors prefer registered accounts (TFSA/RRSP) for simplicity. In taxable accounts, consider after‑tax yield and the treatment of Canadian bond interest. Always confirm with a tax professional for your situation.