Beginner to AdvancedQuantitative FinancePython / Excel
Backtesting is how you turn a promising idea into a reliable investment strategy. By simulating rules on historical data, you quantify returns, risk, and failure points before risking capital. In this guide you’ll learn exactly how to backtest your investment strategy end‑to‑end: data sourcing, bias control (look‑ahead, survivorship), robust metrics (CAGR, Sharpe, Max DD), and advanced validation (walk‑forward, Monte Carlo).
2. Key Takeaways
- Split data into in‑sample and out‑of‑sample; validate with walk‑forward.
- Always model transaction costs & slippage; re‑test sensitivity to costs.
- Use downside‑aware metrics (Sortino, Max DD, Calmar), not Sharpe alone.
- Probe robustness with Monte Carlo and scenario stress tests.
- Automate reports; alert when performance deviates from historical expectations.
3. Why Backtesting Your Investment Strategy Matters
Without a reproducible backtest, investors overfit to anecdotes and underprice risk. Proper backtesting helps you validate edge, quantify expected drawdowns, and compare strategies to simple baselines like buy‑and‑hold or DCA vs Lump Sum.
4. Key Concepts & Bias Control
4.1 In‑Sample vs Out‑of‑Sample
Use 70/30 or roll with walk‑forward. Never tune on test data.
4.2 Look‑Ahead Bias
Only use information available at the decision time. Align indicators to avoid peeking.
4.3 Survivorship Bias
Include delisted symbols when possible to avoid overstating returns.
4.4 Costs, Spread, Impact
Model commissions, half‑spread slippage, and size‑based impact for realism.
5. Data Sources & Tools
- Free daily: Yahoo Finance, Stooq (adjusted close).
- APIs: Alpha Vantage, Polygon.io, Interactive Brokers (intraday).
- Libraries: Python (pandas, Backtrader), R (quantmod), Excel/VBA.
- Web: Portfolio Visualizer for quick multi‑asset tests.
For quick scenarios, try the WhatIfInvested Simulator; for advanced features (multi‑portfolio, auto‑rebalancing), see Premium DCA Calculator.
6. Building a Backtesting Framework
- Preprocess prices (splits, dividends), fundamentals, and calendars.
- Modularize: signals, execution, portfolio, risk, reporting.
- Simulate orders with realistic fill assumptions and cash accounting.
- Log trades/events; export daily portfolio NAV.
class BacktestEngine:
    def __init__(self, data, strategy):
        self.data = data
        self.strategy = strategy
        self.portfolio = Portfolio()
    def run(self):
        for ts, row in self.data.iterrows():
            sig = self.strategy.generate(row)
            self.portfolio.execute(sig, ts)
        return self.portfolio.performance()
7. Defining Strategy Rules
- Entry: e.g., 50‑DMA cross above 200‑DMA with RSI < 30.
- Exit: close below 50‑DMA or RSI > 70.
- Sizing: fixed‑fraction vs ATR‑volatility targeting.
- Risk: initial stop, trailing stop, max portfolio drawdown.
8. Running the Backtest
- Load & clean data (adjust splits/dividends).
- Instantiate strategy & portfolio; set seeds where applicable.
- Iterate, generate signals, simulate fills.
- Record trades, NAV, exposure; export CSV.
- Review metrics vs benchmark buy‑and‑hold.
9. Performance Metrics
- CAGR: ((final/initial)^(1/years) − 1)
- Sharpe / Sortino: reward per unit of (downside) volatility
- Max Drawdown & Duration
- Calmar: CAGR / Max DD
- Win rate, payoff, profit factor
Also report rolling metrics (12–36m windows) to detect regime sensitivity.
10. Drawdown Analysis
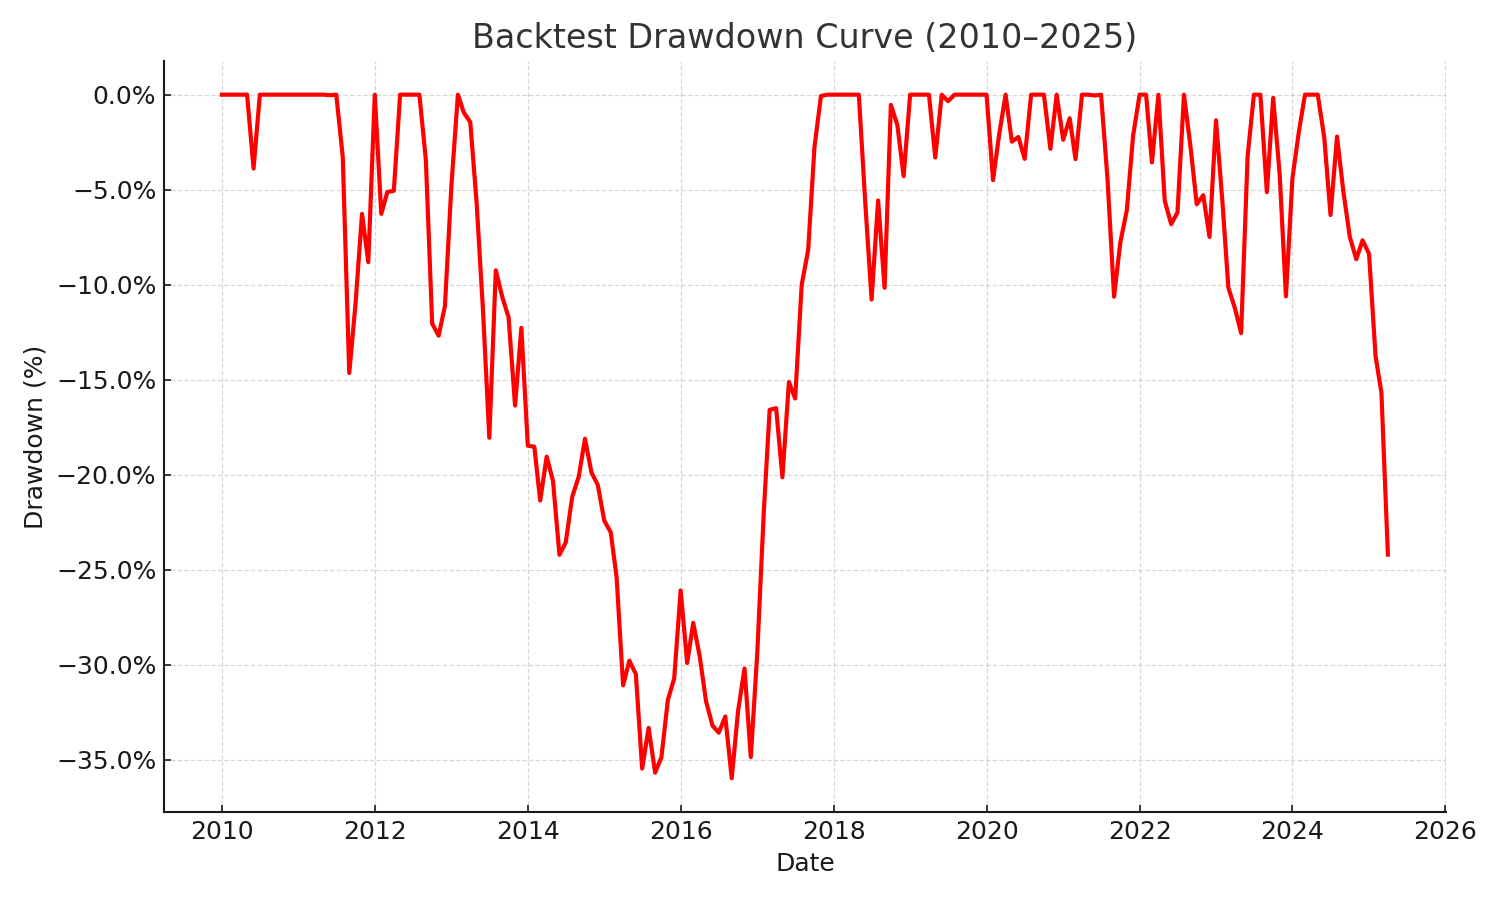
- Depth (magnitude)
- Duration (time to recover)
- Recovery factor (total return / max DD)
11. Walk‑Forward Analysis
Re‑optimize on rolling in‑sample windows and validate on the next out‑of‑sample slice; aggregate OOS performance.
12. Monte Carlo Simulation
- Bootstrap monthly returns with replacement
- Block bootstrap to preserve autocorrelation
- Parametric simulation (e.g., Student‑t)
13. Backtest vs Walk‑Forward vs Monte Carlo
| Method | Purpose | Strengths | Limitations | When to Use |
|---|---|---|---|---|
| Single Backtest | Baseline performance | Simple, fast | Path‑dependent, overfit risk | Early prototyping |
| Walk‑Forward | OOS validation | Closer to live deployment | Heavier compute | Parameter selection |
| Monte Carlo | Outcome distribution | Quantifies tail risk | Modeling assumptions | Risk budgeting |
14. Stress Testing & Scenario Analysis
- Shock −30% on equity index; inspect strategy DD & exposure
- Sideways regime (flat drift) for 18–24 months
- Volatility spike; widen spreads & slippage
15. Optimization vs Overfitting
- Limit parameter count; prefer simpler models with similar performance
- Use cross‑validation & walk‑forward
- Penalize complexity in selection criteria
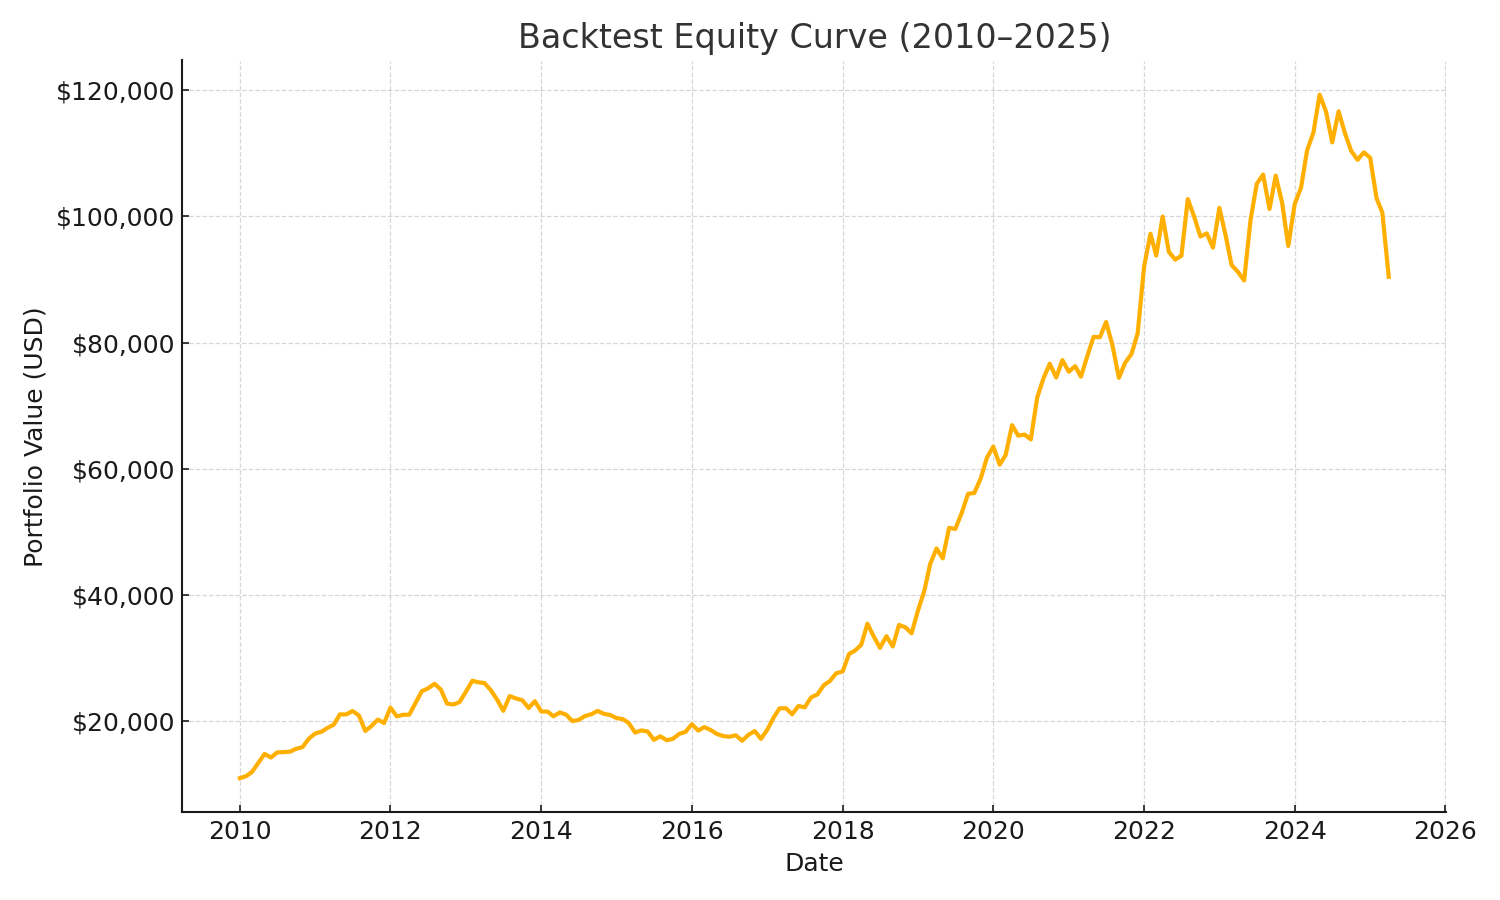
16. Reporting & Visualization
- Equity curve
- Drawdown curve
- Monthly return histogram
- Performance table (CAGR, Sharpe, Max DD, Calmar)

Run multi‑portfolio scenarios, auto‑rebalance, export results, and more with the Premium DCA Calculator.
17. Implementation & Automation
- Version control (Git) and CI to run periodic backtests
- Data pipelines for ingestion/cleaning
- Automated reports with alerts on KPI drift
18. Common Pitfalls & Best Practices
- Survivorship bias (use historical constituents)
- Look‑ahead & data snooping
- Ignoring costs & market impact
- Overfitting; lack of OOS validation
19. Transaction Costs & Slippage
- Commission (e.g., 0.1% per trade) + half‑spread slippage
- Impact cost proportional to order size & liquidity
- Sensitivity analysis to cost assumptions
20. Risk Management Integration
- Volatility‑based sizing (ATR, stdev)
- Portfolio‑level DD circuit breaker
- Tail hedges (options overlay, vol strategies)
For practical budget/risk planning, see WhatIfBudget.
21. Tools & Resources
22. FAQ
Does strong backtest performance guarantee live results?
No. Treat backtests as evidence, not proof. Markets shift; always validate OOS and monitor.
How much historical data do I need?
Ideally a full cycle (5–10 years) for positional strategies; more for slower systems.
Should I include fundamental data?
Yes—quality, value, and macro factors often improve robustness beyond prices alone.
What’s the minimum set of metrics to track?
CAGR, Sharpe/Sortino, Max DD, DD duration, profit factor, exposure, turnover.
How do I avoid overfitting when optimizing?
Limit parameters, use nested CV or walk‑forward, and prefer simpler rules when performance is similar.
How should I model slippage?
At least half‑spread per trade; scale with volatility or order size for realism.
24. Conclusion
By controlling bias, modeling costs, and validating with walk‑forward and Monte Carlo, you turn ideas into dependable strategies. Start simple, benchmark against buy‑and‑hold, then layer robustness tests and automation.