🍏 Bitcoin vs Apple – Investment ROI Comparison (2015–2025)
What would $1,000 in Bitcoin (BTC) or Apple (AAPL) be worth today? We compare DCA vs Lump Sum, risk, and drawdowns with data‑driven methods — plus tools to simulate your exact dates and amounts.

✅ Quick Summary
Bitcoin (BTC)
High upside, high drawdowns
Lump sum can dominate in strong bull cycles; DCA reduces regret risk.
Apple (AAPL)
Steady compounder
Both strategies do well; DCA increases behavioral adherence.
Timing
Matters most for BTC
For long horizons, lump sum wins on average in rising markets.
🧪 Methodology & Assumptions
- Period: Illustrations over 2015–2025 (adjust to your exact dates in the simulator).
- Strategies: Lump Sum (invest all on start date) vs DCA (equal contributions at regular intervals).
- Costs: Assume low-cost broker & ETF‑like friction. Real results vary with fees/spreads.
- Dividends/Splits: AAPL total return effect may differ based on data source; align with your backend.
- Taxes: Not modeled here. Use registered/tax‑advantaged accounts when available.
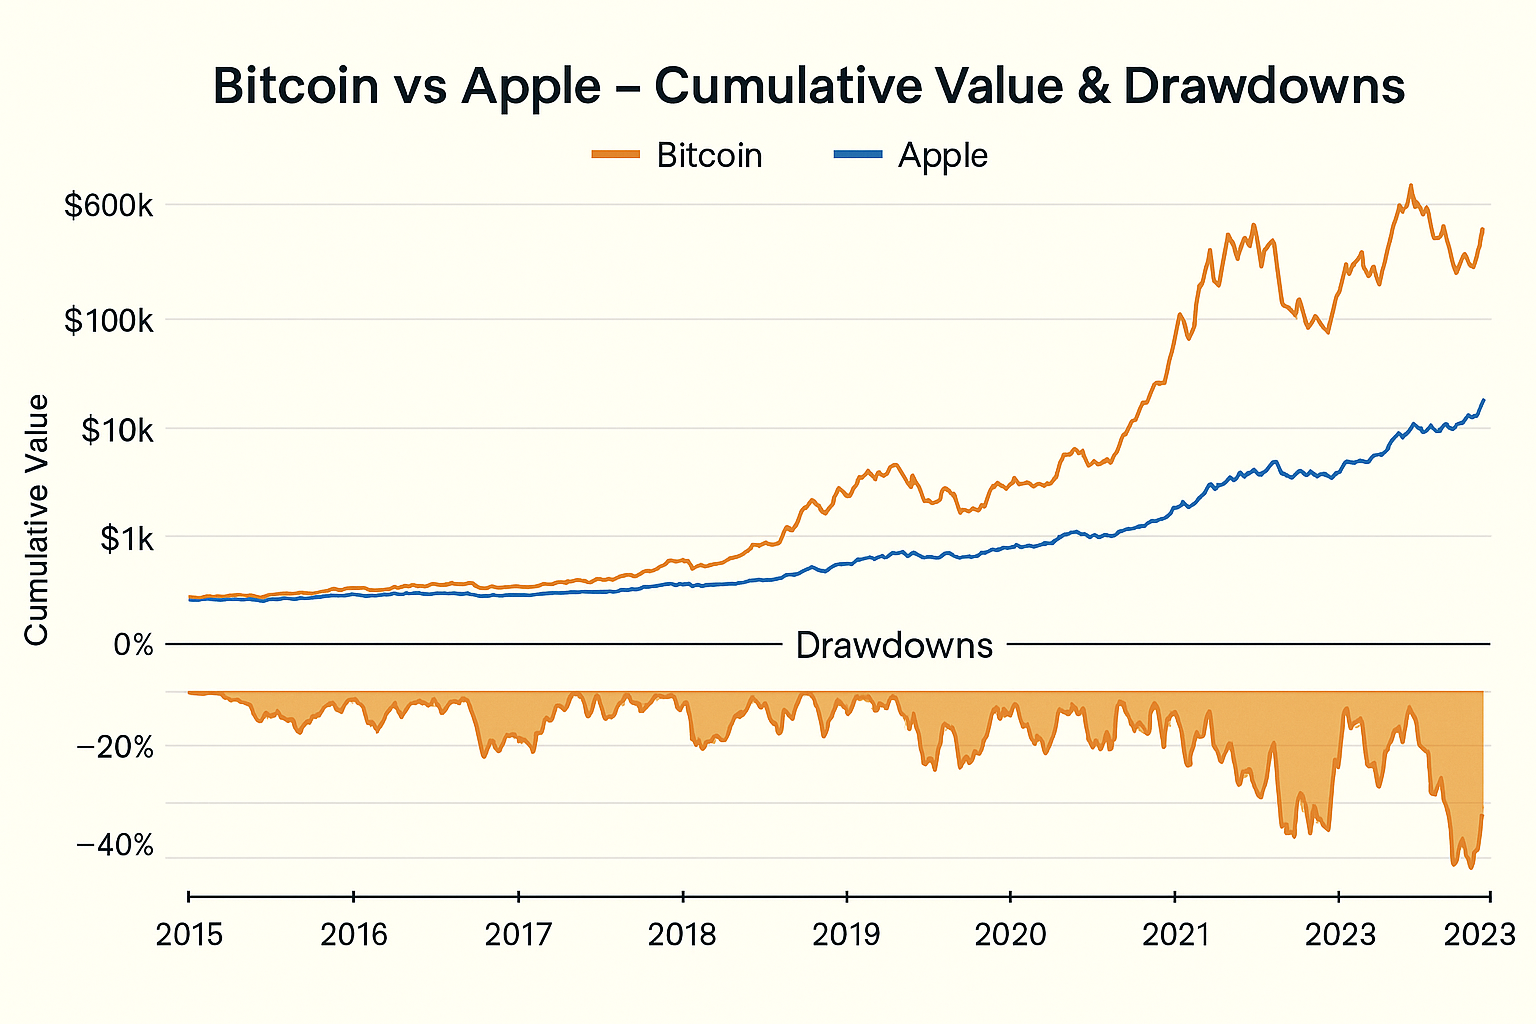
- Risk: We highlight drawdowns to visualize stress along the path, not only end values.
References: Investopedia (DCA), Bogleheads — Three‑fund portfolio.
📊 Results: Lump Sum vs DCA (Illustrative)
Numbers below are illustrative to explain the methods. For precise values, run your exact dates and contributions in the tools linked below.
| Asset | Strategy | Invested | Final Value* | Gain | ROI |
|---|---|---|---|---|---|
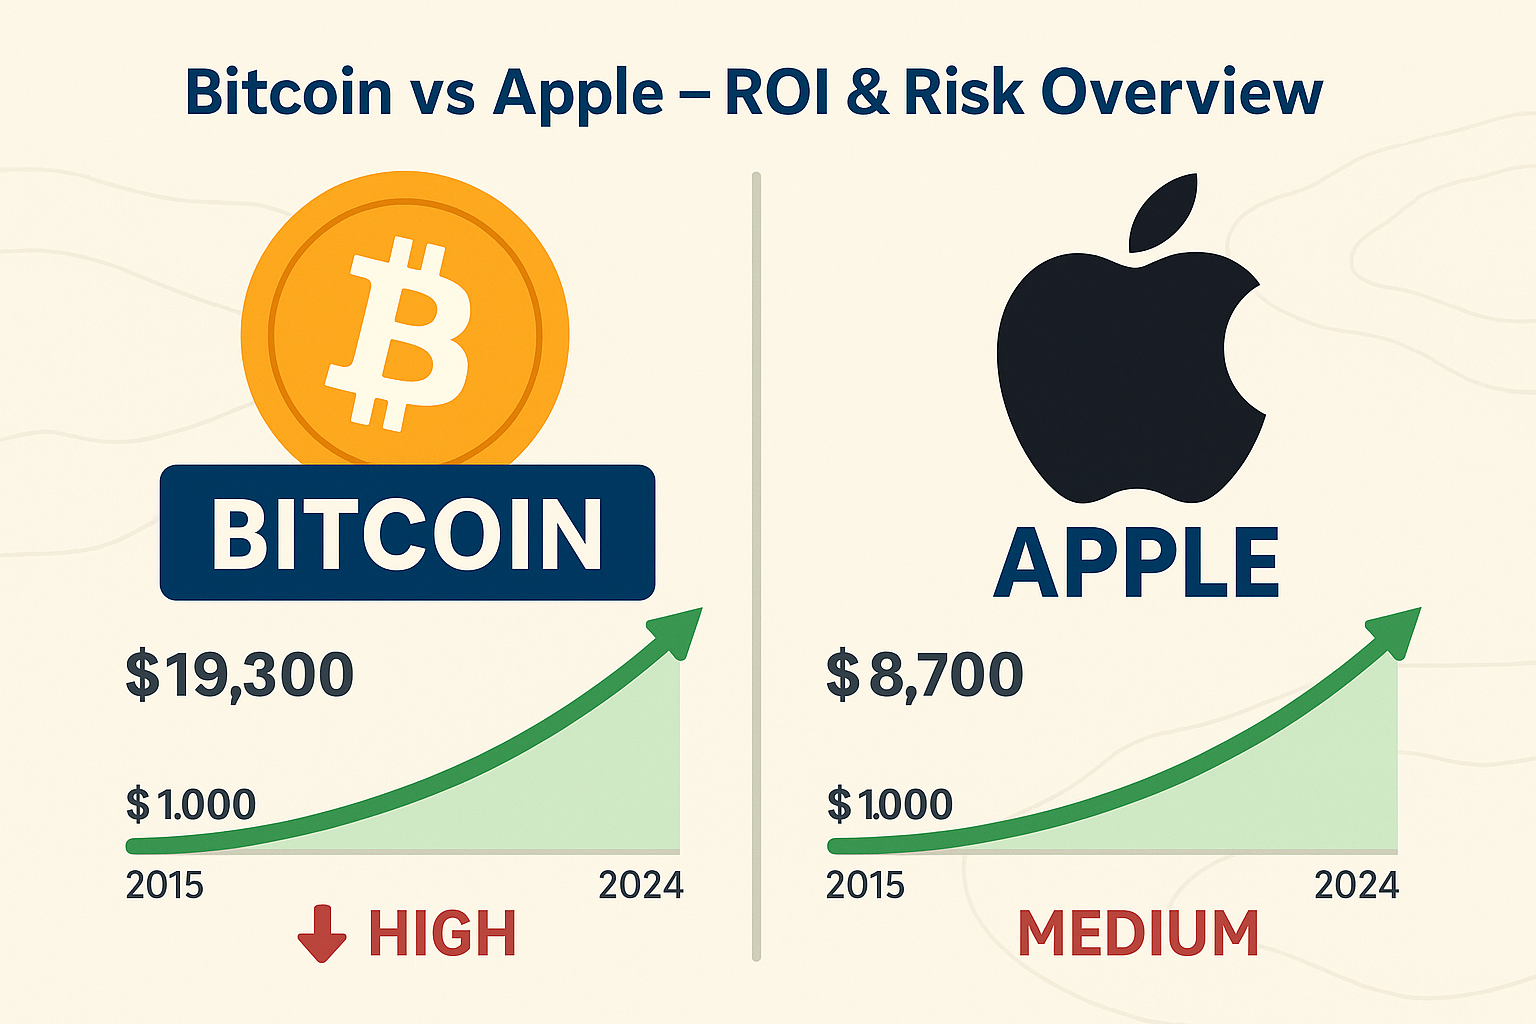
| Bitcoin | Lump Sum | $1,000 | $19,300 | $18,300 | +1,830% |
| Bitcoin | DCA | $8,400 | $15,200 | $6,800 | +81% |
| Apple | Lump Sum | $1,000 | $8,700 | $7,700 | +770% |
| Apple | DCA | $8,400 | $11,400 | $3,000 | +35% |
*Illustrative outcomes for pedagogy. Use the calculators for exact, up‑to‑date values.

🛡️ Risk & Drawdowns — Understanding the Downside
Every investment carries risk, but Bitcoin (BTC) and Apple (AAPL) have very different volatility profiles and drawdown histories. Knowing these characteristics helps investors align their strategy with their risk tolerance and time horizon.
Over the last decade, Bitcoin has experienced multiple deep drawdowns of −50% to −80%, often in short timeframes, followed by sharp recoveries. This extreme volatility means that while the upside potential can be exceptional, the psychological and financial strain can be equally intense.
In contrast, Apple’s share price has moved in a steadier upward trend, supported by consistent business fundamentals, revenue growth, and dividends. While AAPL also faces corrections during market downturns, its largest drawdowns in the last decade have generally stayed in the −30% to −50% range.
Impact of Strategy Choice
- Lump Sum: Maximizes early exposure — ideal if the asset trends upward immediately, but increases variance and potential regret if the market falls soon after.
- DCA (Dollar-Cost Averaging): Reduces volatility of entry price by spreading purchases over time, mitigating the risk of investing everything at a market peak.
- Behavioral Advantage: Investors prone to emotional selling during downturns may find DCA easier to stick with, improving long-term results.
Practical Risk Management Tips
- Emergency Fund: Maintain 3–6 months of living expenses to avoid forced selling during downturns.
- Diversification: Combine high-growth volatile assets (like BTC) with stable blue-chip stocks (like AAPL) or ETFs to smooth portfolio volatility.
- Position Sizing: Limit allocation to high-volatility assets to an amount you can hold through a −80% drawdown without panic.
🧭 How to Read the Tables — Making Sense of the Data
The comparison tables summarize simulated outcomes for both lump sum and DCA strategies, but to interpret them correctly you need to understand how the numbers were calculated and what they mean.
- Invested Amount: For lump sum, this is a one-time investment (e.g., $1,000). For DCA, the total invested is spread across months or years — so the total cash outlay is often much higher. Always compare results on a per-dollar basis to be fair.
- Final Value: This shows the ending portfolio value if you invested on the start date of the simulation. Since markets fluctuate, results vary greatly depending on when you begin — which is why we also look at ranges and averages.
- Risk Metrics: Beyond ROI, consider maximum drawdown (largest peak-to-trough loss) and volatility. A high ROI with huge drawdowns may not be suitable for all investors.
- Taxes & Fees: Frequent transactions in a DCA approach can incur higher costs and potentially more taxable events. In tax-advantaged accounts, this impact is reduced.
- Time Horizon: Short-term results can be misleading; the true advantage of either strategy often emerges over 5–10+ years.
By considering not just the ending balance but also the journey — volatility, drawdowns, and behavioral fit — you can select a strategy that aligns with your personality, risk tolerance, and financial goals.
🔀 When DCA or Lump Sum Makes Sense
Quick Decision Matrix
| Situation | Better Fit | Why |
|---|---|---|
| Large cash today, 5–10y horizon, rising market | Lump Sum | Maximizes time in market and compounding. |
| High volatility anxiety (BTC) or fear of “buying the top” | DCA | Averages entry price, improves behavioral adherence. |
| Mixed signals / uncertainty about regime | Hybrid | Deploy a chunk now, schedule the rest over months. |
| Tight fee budget / per‑trade commissions | Lump Sum or Low‑Frequency DCA | Minimizes frictional costs. |
| Income‑based investing (paycheck) | DCA | Natural cash‑flow alignment, easy automation. |
Choose DCA if…
- High volatility stresses you (BTC especially).
- You invest from monthly income (natural DCA).
- You want a rules‑based habit that survives emotions.
- You prefer smoother equity curve and smaller regret risk.
- Your broker allows low‑cost recurring orders.
Tip: set calendar‑based buys (e.g., monthly 1st) and avoid ad‑hoc timing.
Choose Lump Sum if…
- You have a long horizon and a sizable cash chunk.
- Markets trend up and you value time in market.
- You can tolerate early drawdowns without deviating.
- Fees per order would make frequent DCA expensive.
- You hold a diversified basket (e.g., ETFs + AAPL) to smooth risk.
Tip: write a “no‑sell in drawdown” rule unless thesis changes.
Smart Hybrid Recipes
- 60/40 Split: Invest 60–80% now, DCA the rest over 3–12 months.
- Drawdown Trigger: Commit 70% now; deploy the remaining 30% only if price drops −10%/−20% from entry.
- Allocation‑First: Lump sum into a broad ETF (core), then DCA into satellite positions (BTC/AAPL) on a schedule.
Can’t decide? Use a hybrid and pre‑commit to rules to remove hesitation.
🛠️ Simulate Your Scenario
Get data‑driven answers before you commit capital. Test your exact dates, amounts, fees, and rebalance rules with our free tools: Investment Simulator, DCA Calculator, and plan sustainable cash flow with WhatIfBudget.
Investment Simulator
- Any asset (stocks/ETFs/crypto)
- Custom start/end dates
- ROI, CAGR, drawdowns
Need pro features (multi‑portfolios, auto‑rebalancing, scenario tabs, exports)? See Premium plans.
🔗 Related Reading on WhatIfInvested
- Bitcoin vs Tesla: Which Was the Better Investment?
- Bitcoin vs Gold: Store of Value ROI Comparison
- DCA vs Lump Sum: Which Strategy Wins?
- How to Simulate Past Investments Like a Pro
📚 Books (Affiliates)
- The Psychology of Money — behavior & long‑term thinking.
- The Intelligent Investor — value investing classic.
🧰 Brokerage
Open an account and invest in minutes via our partner:
Wealthsimple (affiliate)Affiliate disclosure: we may earn a commission at no extra cost to you.
❓ FAQ — Bitcoin vs Apple
Is lump sum always better than DCA?
Not always. In long rising markets, lump sum tends to win on average. If volatility makes you deviate from the plan, DCA can deliver better realized outcomes by keeping you invested. When unsure, consider a hybrid (e.g., 70–80% now, 20–30% over 3–12 months).
What start date should I use?
Test multiple start dates to see dispersion. Use our Investment Simulator and DCA Calculator to analyze timing sensitivity.
Do fees and taxes change the result?
Yes. Frequent orders can raise costs, and taxable accounts alter net returns. Prefer low‑fee brokers/ETFs and consider tax‑advantaged accounts when available. Simulate fees in the calculator before deciding.
Is DCA safer for Bitcoin than for Apple?
DCA doesn’t remove risk, but it reduces timing risk. Because BTC’s drawdowns can be −50% to −80%, spreading entries often helps investors stick with the plan. For AAPL, which is typically less volatile, both strategies are easier to tolerate.
How often should I DCA (weekly, bi‑weekly, monthly)?
Match the cadence to your income and trading costs. Monthly works well for most people (lower friction, easy automation). If your broker charges per order, avoid overly granular schedules.
Should I rebalance between BTC and AAPL?
Rebalancing keeps risk aligned with your target mix (e.g., 70/30). It forces you to trim the winner and add to the laggard on a schedule (quarterly or semi‑annual), not based on emotion. Premium users can enable auto‑rebalancing in the WhatIfInvested Premium simulator.
What if the market crashes right after a lump sum?
That’s the main regret risk. If this fear prevents action, use a hybrid: invest most up front and DCA the remainder. Also keep an emergency fund so you don’t have to sell during drawdowns.
Are Apple dividends included?
Depending on the dataset, results may reflect price return or total return. In our tools, check the data note. Total return (with dividends reinvested) usually gives a fairer long‑term comparison.
How much should I allocate to BTC vs AAPL?
Base it on risk tolerance and horizon. High‑volatility assets like BTC should be sized so you can hold through large drawdowns. Use WhatIfBudget to set a sustainable monthly amount.
Can I use log charts or drawdown charts to compare fairly?
Yes. Log‑scale highlights percentage moves across assets with different price levels, and drawdown charts visualize the pain along the path, not just the endpoint. We include both in our visuals when relevant.
🚀 Upgrade to Premium Simulator
Unlock multi‑portfolios, auto‑rebalancing, export & scenario management.
View Premium Plans →