Investment Simulator With Historical Returns
An investment simulator with historical returns helps you test how a stock, ETF, crypto asset, portfolio or contribution plan would have behaved through real market data. Instead of relying on a smooth expected return, you can study actual paths: bull markets, crashes, recoveries, flat periods, timing risk and the emotional shape of an investment journey.
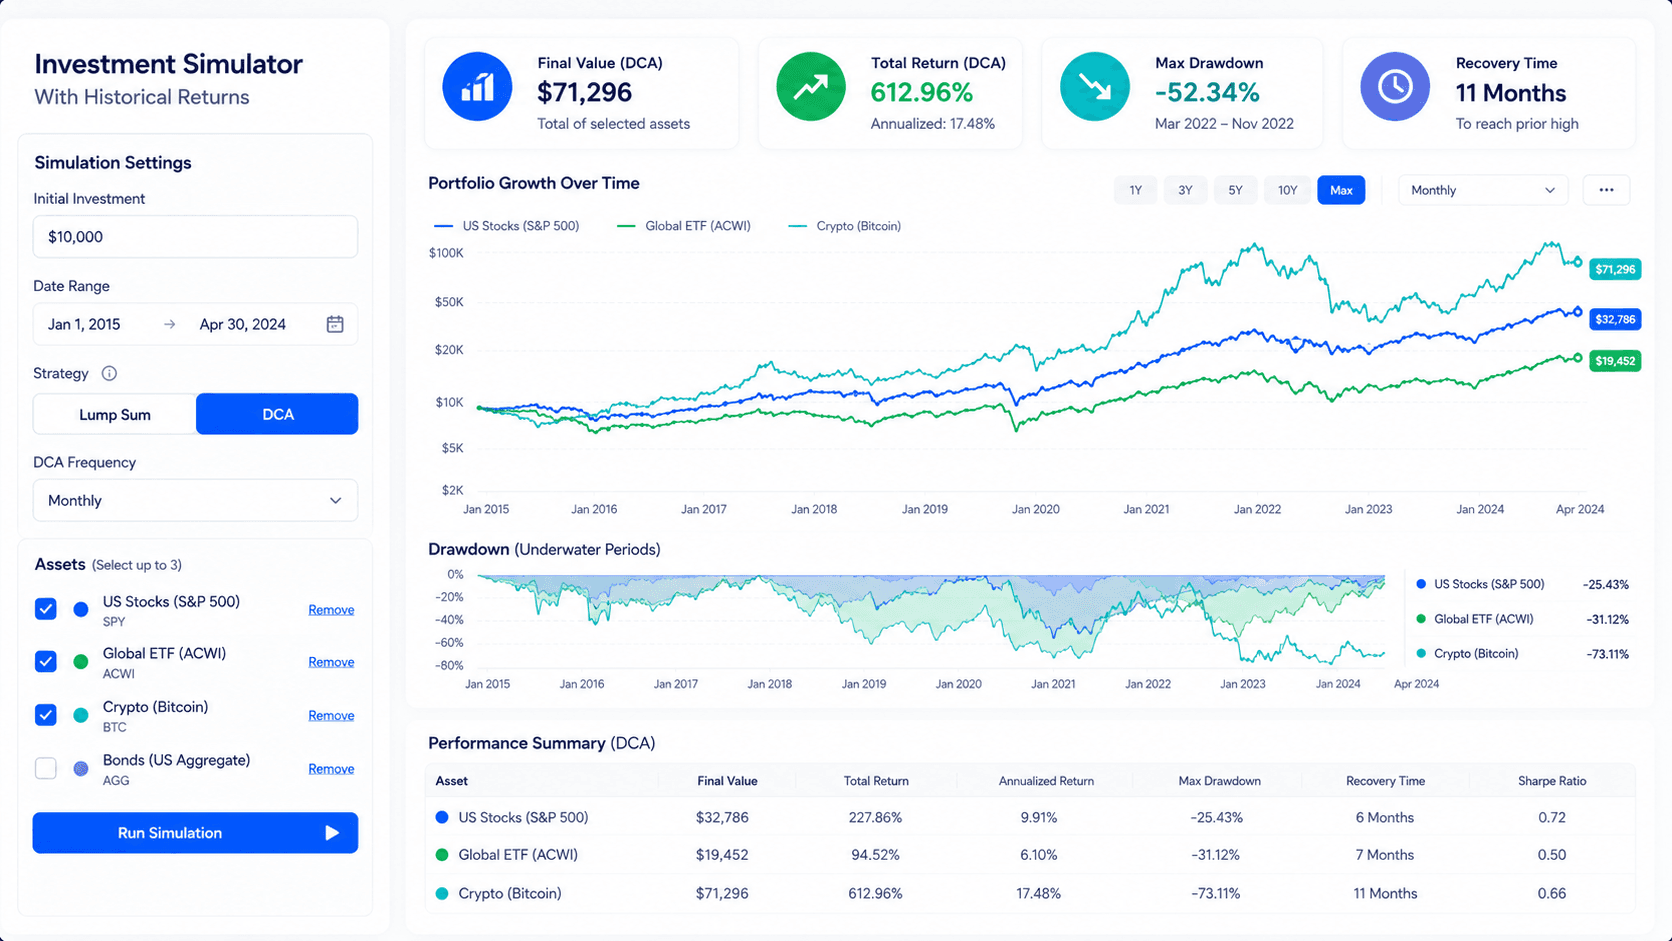
Investment simulator with historical returns: what it shows
The simulator turns a hypothetical investment into a historical path. It can show final value, total return, drawdowns, recovery periods and how different contribution choices changed the experience. That makes it more useful than a single average-return estimate.
Quick answer: when to use a historical investment simulator
Use an investment simulator with historical returns when you want to understand how an investment idea behaved in real markets. It is especially useful for testing a lump sum investment, a dollar-cost averaging plan, a crash-period strategy, an ETF comparison, a crypto allocation or a long-term portfolio idea. Historical returns do not predict the future, but they reveal the kind of volatility and timing risk a strategy has already faced.
The best first test is simple. Choose one asset, one start date, one investment amount and one strategy. Run the simulation, then read the path. Did the result come from steady growth, one explosive period, a long recovery or a lucky starting date? After that, compare a second scenario. If the result changes dramatically when the start date moves, timing risk is a major part of the story.
On this page
Run this test in the Investment Simulator
Use this article as the interpretation guide, then open the free Investment Simulator with one clean question. The strongest first simulation is not the most complex one. It is the one that isolates a real decision: one asset, one period, one investment method and one result you can compare.
What historical returns really mean
Historical returns are the returns that actually happened during a past market period. For a stock, that may include price changes and sometimes dividends. For an ETF, it may reflect the behavior of the underlying index or fund. For crypto, it may reflect a market that trades continuously and can move sharply outside normal stock market hours. A simulator uses those historical data points to rebuild what a hypothetical investment might have looked like.
This is different from a forward-looking compound interest calculator. A compound growth estimate usually applies one annual return assumption smoothly across time. A historical simulator uses a real sequence of gains and losses. That sequence matters. Two portfolios can have the same average return and still feel very different if one suffers a deep early drawdown while the other rises steadily.
For investors, the path is often more important than the final value. A strategy that ended well may still have required surviving a 40% decline. A plan that looked weak over one period may have worked better over a longer window. A lump sum investment may beat DCA in a rising market, while DCA may feel easier during a volatile period. Historical returns help reveal those tradeoffs.
That is why WhatIfInvested treats simulation as a decision tool rather than a prediction machine. The goal is not to say “this will happen again.” The goal is to ask: if a similar kind of market path happened, would this strategy still make sense?
Five smart tests to run first
The best simulations start with a clear question. If the question is vague, the output becomes entertainment instead of decision support. A simulator can produce interesting charts all day, but the useful test is the one tied to a real choice: should I invest now, contribute monthly, compare two assets, avoid concentration or upgrade to a deeper workflow?
| Test | Question it answers | Best next step |
|---|---|---|
| Lump sum test | What if I invested all at once on a specific date? | Compare with DCA on the same asset. |
| DCA test | What if I contributed monthly through the same period? | Use the DCA Calculator for contribution planning. |
| Crash window test | How did the strategy behave during a major drawdown? | Read the drawdown and recovery path. |
| Asset comparison | Which asset had the better historical path and risk? | Compare final value and volatility, not only ROI. |
| Premium scenario test | What if I need several assumptions, weights or reports? | Move to Premium workflow. |
Start with the free Investment Simulator when you want a quick historical scenario. Use How to Backtest Your Investment Strategy when you need a full tutorial for designing and interpreting a backtest.
Inputs that matter in an investment simulator with historical returns
The first input is the asset or portfolio being tested. A broad ETF, a single stock and a crypto asset can produce very different historical experiences. The asset choice determines the return path, volatility, drawdowns and recovery behavior. If the asset is concentrated, the simulation may look dramatic, but it may also be less useful for a diversified long-term plan.
The second input is the start date. Start date sensitivity is one of the most important lessons a historical simulator can teach. A strategy that begins near a market bottom may look brilliant. The same strategy beginning near a peak may look disappointing for years. This does not mean the strategy is good or bad by itself. It means timing affected the result.
The third input is the investment method. Lump sum invests immediately. DCA spreads the entry over time. Recurring contributions add new money through the period. These methods answer different questions. If you already have a large amount of cash, lump sum vs DCA matters. If you are investing from income, recurring contribution behavior matters more.
The fourth input is the end date or holding period. A short holding period can exaggerate timing. A longer holding period can reveal whether a strategy recovered from bad periods. This is why investors should test multiple time windows instead of relying on one flattering chart.
The fifth input is friction. Fees, taxes, spreads, dividends, currency conversion and inflation may not all be visible in every simple simulator. Yet they can change the result in real life. Before turning a backtest into a decision, ask whether the simulation includes the frictions that matter to your account.
How to read historical simulation results
The ending value is not enough. A good historical simulation should be read in layers. First, look at the final value and total return. Then look at the path. Did the portfolio rise smoothly, fall deeply before recovering, or spend years flat? A result that ends well but requires enormous patience may not be suitable for every investor.
Next, read the drawdown. Drawdown shows the decline from a previous high. If an investment fell 45% before recovering, the final return does not erase the emotional challenge. Many investors sell during drawdowns, which means the theoretical return may not match the return they actually capture. The simulator helps you ask whether you could live through the path.
Then compare contributions and returns. In a DCA scenario, the result may depend heavily on contributions rather than market growth, especially in the early years. That is not a weakness. It shows that savings behavior is part of the strategy. For longer periods, investment growth may become more important as the account balance compounds.
Finally, compare more than one scenario. A single simulation can mislead because it depends on one asset, one start date and one market path. A stronger workflow tests several periods: a bull market, a crash, a recovery and a flat market. If the strategy is only attractive in one perfect window, it may not be robust.
Historical returns vs expected returns
Historical returns and expected returns answer different questions. Historical returns ask what happened. Expected returns ask what might be reasonable going forward. A historical simulator is strongest when you want to understand real volatility and sequence risk. An expected-return calculator is strongest when you want a forward-looking planning estimate.
The danger is using history as if it were destiny. If an asset had a strong decade, that does not mean the next decade will match it. If an asset had a weak period, that does not mean it is permanently broken. Historical returns provide evidence, but they do not remove uncertainty.
A practical workflow is to use both. Start with the historical simulator to understand the shape of past outcomes. Then use the DCA Calculator or compound-growth tools to test forward-looking contribution assumptions. This combination is stronger than either tool alone because it combines path awareness with planning discipline.
Data quality matters more than a beautiful chart
A historical return chart can look polished and still be misleading if the data behind it is weak. Before trusting a simulation, ask what price series is being used, whether the data includes dividends, whether prices are adjusted for splits, how missing days are handled and whether the simulator uses daily, monthly or annual observations. These details sound technical, but they can change the result.
For stocks and ETFs, adjusted prices are often more useful than raw prices because they can account for splits and distributions. If a simulator ignores dividends for a dividend-paying ETF, the long-term result may understate the investment’s total return. If it mishandles splits, the result can become obviously wrong. For crypto, the issue is different: the asset may trade continuously, but exchange prices, liquidity and data availability can vary across history.
The time interval also matters. A monthly simulation may be good enough for long-term planning, but it can hide sharp intramonth drawdowns. A daily simulation may show more detail, but it can create a false feeling of precision if the investor is making a broad long-term decision. The right data frequency depends on the decision. Retirement-style investing usually does not need minute-level accuracy. Short-term trading analysis would need a different tool and a different standard.
WhatIfInvested’s simulator workflow should be read with this mindset: the chart is a decision aid, not a guarantee. If the result is important, compare it with the Methodology page and check whether the assumptions match the question you are trying to answer.
Benchmarks make historical simulations more useful
A single asset simulation can be interesting, but a benchmark gives it context. If a stock grew 300% over a period, that sounds impressive until you compare it with a broad market ETF that may have delivered similar growth with less company-specific risk. If a crypto asset produced a huge return but fell 80% along the way, a benchmark can help you decide whether the extra volatility was worth it.
The benchmark should match the question. A U.S. large-cap stock might be compared with an S&P 500 ETF. A growth-oriented asset might be compared with a Nasdaq-style benchmark. A defensive or dividend strategy might be compared with a broad market fund and a bond allocation. The goal is not to prove one asset is always better. The goal is to understand what was earned relative to a simpler alternative.
Benchmarks are also useful for avoiding story bias. Investors often remember the assets that became famous and forget the alternatives that quietly performed well. A simulator can make a famous asset look inevitable in hindsight. A benchmark reminds you that every decision had an opportunity cost. Money invested in one asset could have been invested somewhere else.
For many visitors, the most practical comparison is simple: test the asset you are curious about, then compare it with a broad ETF and a recurring contribution plan. That gives you a clearer view of performance, volatility and behavior. If the asset wins only because of one lucky window, the decision may require more caution.
Dividends, fees, taxes and inflation can change the story
Historical return simulations often focus on price growth, but real investor outcomes are affected by more than price. Dividends can increase total return. Fund fees can reduce it. Taxes can change after-tax performance. Currency conversion can matter for international investors. Inflation can reduce purchasing power even when the account value rises.
This is why two investors can run similar-looking strategies and end up with different real-world results. One investor may hold a tax-efficient ETF in a tax-advantaged account. Another may trade frequently in a taxable account and lose part of the return to taxes and costs. A simulator cannot know every personal tax detail, so the user should treat the output as a pre-tax or simplified estimate unless the tool clearly says otherwise.
Inflation is especially important for long horizons. A final value may look large in nominal dollars, but the future purchasing power could be lower than expected. If you are testing a 20-year or 30-year strategy, it helps to think in both nominal and real terms. A strong historical return may still feel less impressive after inflation and taxes.
For general investor education, Investor.gov explains that dollar-cost averaging is a disciplined way to invest over time, but it does not eliminate risk or guarantee profit. That same principle applies to historical return simulation: the tool can improve understanding, but the investor still has to understand costs, risk and uncertainty.
How to turn a simulation into a better decision
A simulation becomes useful when it changes the next action. If the result shows that the asset had a strong return but a painful drawdown, the next action might be to lower the position size. If the result shows that DCA reduced regret but lowered final value in a rising market, the next action might be to combine a partial lump sum with recurring contributions. If the result shows that one start date dominates the result, the next action might be to test more periods.
A good decision workflow has four steps. First, write the question before running the simulator. Second, run the simplest version of the scenario. Third, change one variable at a time: start date, contribution method, asset or holding period. Fourth, write down what the result actually taught you. This prevents the simulator from becoming a chart generator with no decision attached.
For example, a user might ask: “Would monthly DCA into SPY have helped me stay invested during the 2008 crisis?” That is a better question than “Was SPY good?” The first question has a time window, an asset and a contribution method. It can lead to a useful conclusion about behavior, drawdown and recovery.
Another user might ask: “How much did entry date matter for Bitcoin?” That question should be tested across several start dates, not one. The goal is to understand sensitivity. If the result changes dramatically from one month to another, the strategy may be more timing-dependent than the headline return suggests.
Limits and common mistakes
The first mistake is choosing only a favorable start date. This is a subtle form of cherry-picking. If a simulation starts at a market bottom, it can make almost any risky asset look smart. A better test includes unfavorable windows too. Try starting before a crash, after a rally and during a flat period.
The second mistake is ignoring survivorship bias. If you test only today’s winners, the past can look cleaner than it really was. Investors in real time did not know which companies, funds or assets would survive and outperform. That is why diversified benchmarks and broad ETFs can be useful comparison points.
The third mistake is ignoring taxes, fees and liquidity. A historical chart may not include transaction costs, fund expense ratios, spreads, dividend taxation or currency conversion. Those frictions can matter, especially for frequent contributions or assets with wider spreads.
The fourth mistake is confusing volatility with failure. A strategy can be volatile and still historically successful. But if the volatility is too large for the investor to tolerate, the strategy may fail behaviorally. The best historical return is useless if the investor cannot stay invested long enough to capture it.
The fifth mistake is treating a simulator as a recommendation engine. The simulator does not know your full financial life, emergency fund, debt, taxes, income stability or risk tolerance. It gives context. You still have to decide whether the scenario fits your real situation.
For a deeper discussion of reliability and assumptions, read Are Investment Simulators Accurate? and the WhatIfInvested Methodology page.
Example workflows
A beginner might start by testing a broad ETF over the last ten or twenty years. The useful question is not only “how much did it grow?” but also “how bad did the worst period feel?” If the drawdown looks uncomfortable, the investor may need a more diversified allocation, a smaller contribution or more education before investing.
A DCA investor might compare a monthly contribution plan with a lump sum investment over the same historical window. This connects naturally with DCA vs Lump Sum. In some rising markets, lump sum may win because money is invested earlier. In choppy markets, DCA may feel easier and reduce timing regret. The simulator makes the tradeoff visible.
A crypto investor might test a highly volatile asset across several start dates. The final returns may be impressive, but the path may include brutal declines. The question is whether the position size would be survivable. Historical returns can reveal both the opportunity and the emotional cost.
A portfolio-focused user might compare a single risky asset with a diversified benchmark. If the single asset wins but with much larger drawdowns, the better decision may depend on risk tolerance rather than final value alone. This is where a Premium workflow can help organize repeated comparisons.
Frequently asked questions
What is an investment simulator with historical returns?
An investment simulator with historical returns is a tool that uses past market data to estimate how a hypothetical investment or contribution plan would have performed over a selected period.
Can historical returns predict future returns?
No. Historical returns show what happened in the past. They can help investors understand volatility, timing risk and drawdowns, but they do not guarantee future performance.
What can I test in an investment simulator?
You can test lump sum investments, DCA plans, ETFs, stocks, crypto assets, crash periods, recovery periods and asset comparisons, depending on the tool’s data coverage.
Is a historical return simulator useful for DCA?
Yes. It can show how recurring contributions behaved through real market periods and how DCA compared with investing all at once over the same window.
What is the biggest mistake when reading simulator results?
The biggest mistake is focusing only on final value. Investors should also read drawdowns, recovery time, start-date sensitivity, fees and whether the path was realistic to hold through.
Should I use the free simulator or Premium?
Use the free simulator for one clear historical scenario. Use Premium when you need multiple scenarios, portfolio weights, fees, saved assumptions, withdrawals or exportable reports.
Do investment simulators include dividends and fees?
Some simulators include dividends and fees, while others use simplified data. Always check the methodology and adjust expectations if taxes, fees, spreads or dividends are not included.
What should I do after running a simulation?
Compare at least one alternative scenario, read the risks, then use the result as decision support. A simulation should guide better questions, not replace financial judgment.