Compound Interest Calculator With Contributions
Compound interest calculator with contributions helps you estimate future investment value, interest earned, total contributions and year-by-year growth from a starting balance plus regular deposits.
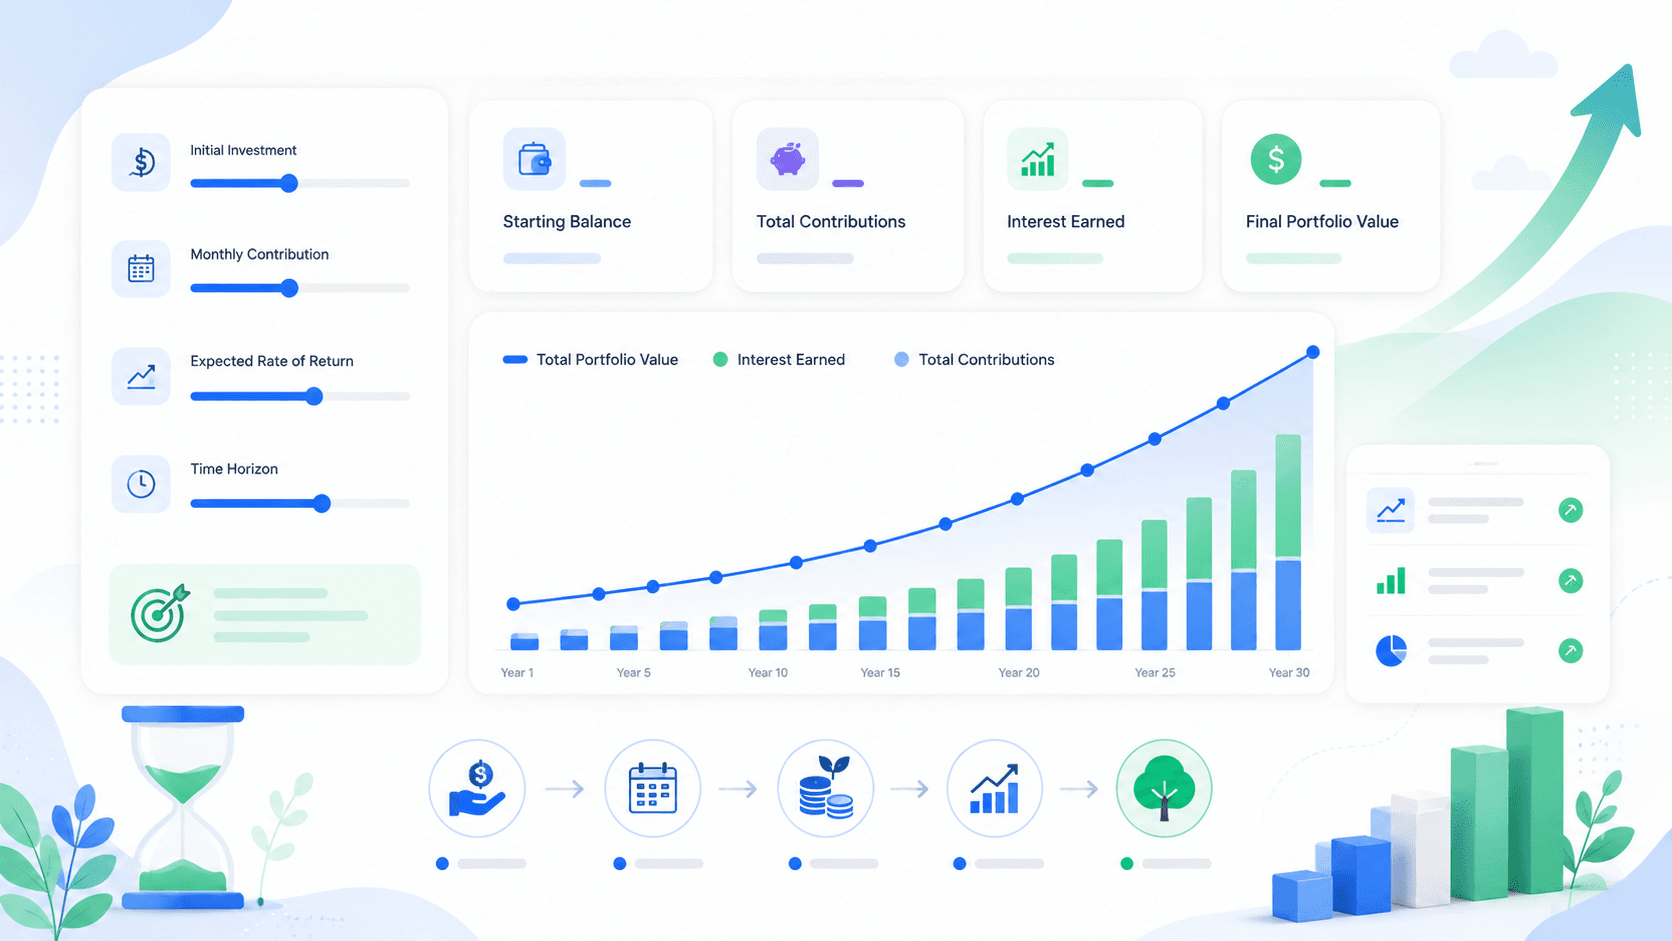
The ending value combines your starting balance, recurring deposits and compound growth. Use the split below to see whether the result is mostly driven by savings behavior or investment growth.
Contributions vs. compound growth
Projected growth
Year-by-year projection
| Year | Starting balance | Contributions | Interest earned | Ending balance |
|---|
How to use this compound interest calculator with contributions
Compound interest projections are most useful when the assumptions are clear. Use this compound interest calculator with contributions to test a base case, then adjust deposits, timeline and expected return to see which factor changes the outcome the most.
Start with real inputs
Enter your current balance, a realistic contribution amount and an expected return that matches the type of asset you are modeling.
Compare scenarios
Run the same projection with and without contributions. This shows how much of the ending value depends on saving behavior.
Review the yearly table
The annual breakdown helps you see when compound growth begins to matter more than new contributions.
Example: $10,000 plus $200 per month
With a $10,000 starting balance, a $200 monthly contribution, an 8% annual return and a 10-year timeline, the ending value can become much larger than the invested capital alone. The exact number depends on when contributions are added, how often returns compound and whether returns stay invested.
This example is useful because it separates two powerful forces: the money you put in and the growth generated by the portfolio itself. In the early years, contributions often do most of the work. Later, compound growth can become a larger part of the annual increase because the balance is bigger.
For long-term planning, compare this projection with a historical backtest in the investment simulator. The calculator shows what could happen under a steady assumed return, while the simulator helps you understand how real historical volatility changed the path.
Why contributions can change the result so much
Compound interest is often explained as growth on growth, but recurring contributions add a second engine. Each new deposit increases the amount of capital that can participate in future returns. Over a long enough period, that can make a major difference between a small projection and a meaningful portfolio.
Early contributions get more time
A contribution made in year one has more years to compound than a contribution made near the end of the timeline. This is why starting earlier can matter even when the monthly amount is modest.
Consistency reduces guesswork
A steady contribution schedule makes the plan easier to measure. Instead of relying on a single perfect investment decision, the projection shows what happens when investing becomes a repeatable habit.
Contribution increases can be powerful
If your income rises, increasing contributions can change the long-term curve. Even small increases may matter because each additional deposit also has the opportunity to earn future returns.
This is also why budgeting and investing are connected. A higher savings rate gives the calculator more capital to work with. If you are not sure how much you can contribute, use WhatIfBudget first, then bring the monthly surplus into this calculator. You can then revisit the projection whenever your income, savings rate or investment assumptions change.
Important assumptions to review
A compound interest calculator with contributions is a planning tool, not a prediction engine. It uses a steady annual return to make the math easier to understand. Real investments move unevenly, and actual results may be higher or lower than the projection.
Market returns are not smooth
Stocks, ETFs and crypto can have strong years, weak years and long flat periods. A steady annual return is useful for planning, but it does not show drawdowns or volatility. For general investing education, review the Investor.gov investing basics.
Fees, taxes and inflation matter
Investment fees, taxes and inflation can reduce real returns. If you are planning for retirement or long-term wealth building, review both nominal growth and purchasing power.
Behavior affects outcomes
The best projection is only useful if the plan can be followed. A realistic contribution amount is often better than an aggressive number that becomes impossible to maintain.
Compound interest vs DCA vs backtesting
Each tool answers a different planning question. Compound interest is best for forward-looking projections. DCA tools are best for recurring contribution schedules. Backtesting is best for studying how a strategy behaved across real market history.
Frequently asked questions
Quick answers for readers comparing contribution schedules, projected growth and investment assumptions.
What is compound interest?
Compound interest is growth earned on both the original amount invested and the returns that have already been added to the balance.
Does this compound interest calculator with contributions include monthly deposits?
Yes. You can add monthly, quarterly, semiannual or yearly contributions and compare the result with a no-contribution scenario.
How often should interest compound?
More frequent compounding can increase the ending value when the annual return is the same, although the difference may be modest for many investing scenarios.
Can I use this for stocks, ETFs or crypto?
Yes. The calculator can model any asset using an assumed annual return, but actual market returns are uncertain and can be negative.
What is a realistic annual return?
A realistic return depends on the asset, fees, inflation and risk level. Long-term stock market assumptions are usually estimates, not guarantees.
Why compare with a simulator?
A compound interest calculator uses smooth assumptions. A simulator helps you study historical volatility, timing risk and real market paths.
Ready to project your investment growth?
Use the compound interest calculator above, then compare recurring investing with the DCA calculator, historical outcomes with the investment simulator or advanced assumptions with Premium.