📉📈 What If You Had Invested in SPY During Every Market Crash?
Keyword focus: SPY crash recovery • Type: Historical analysis • Updated:
Every bear market feels different, but the question long‑term investors ask is the same: how reliably does SPY recover after a crash? In this deep‑dive, we walk through major downturns—dot‑com (2000–2002), the Global Financial Crisis (2008–2009), and COVID‑19 (2020)—to understand typical drawdowns, recovery timelines, and practical strategies. You’ll also see how dollar‑cost averaging (DCA) compares with lump‑sum investing during stress, and how to design a plan that’s survivable both financially and emotionally.
Tip: To stress‑test your plan, backtest different contribution patterns in our free tools and premium simulator:
🧭 What counts as a “market crash” (for SPY)?
In practice, investors use thresholds to categorize declines. A correction is often defined as a drop of ~10% from a recent peak; a bear market typically implies a decline of ~20% or more. SPY, which tracks the S&P 500, has lived through multiple episodes of both. For portfolio planning, what matters isn’t the exact label but the magnitude of drawdown, the speed of decline, and the time to recovery (return to prior peak).
| Event | Type | Approx. drawdown | Recovery time | Investor stressors |
|---|---|---|---|---|
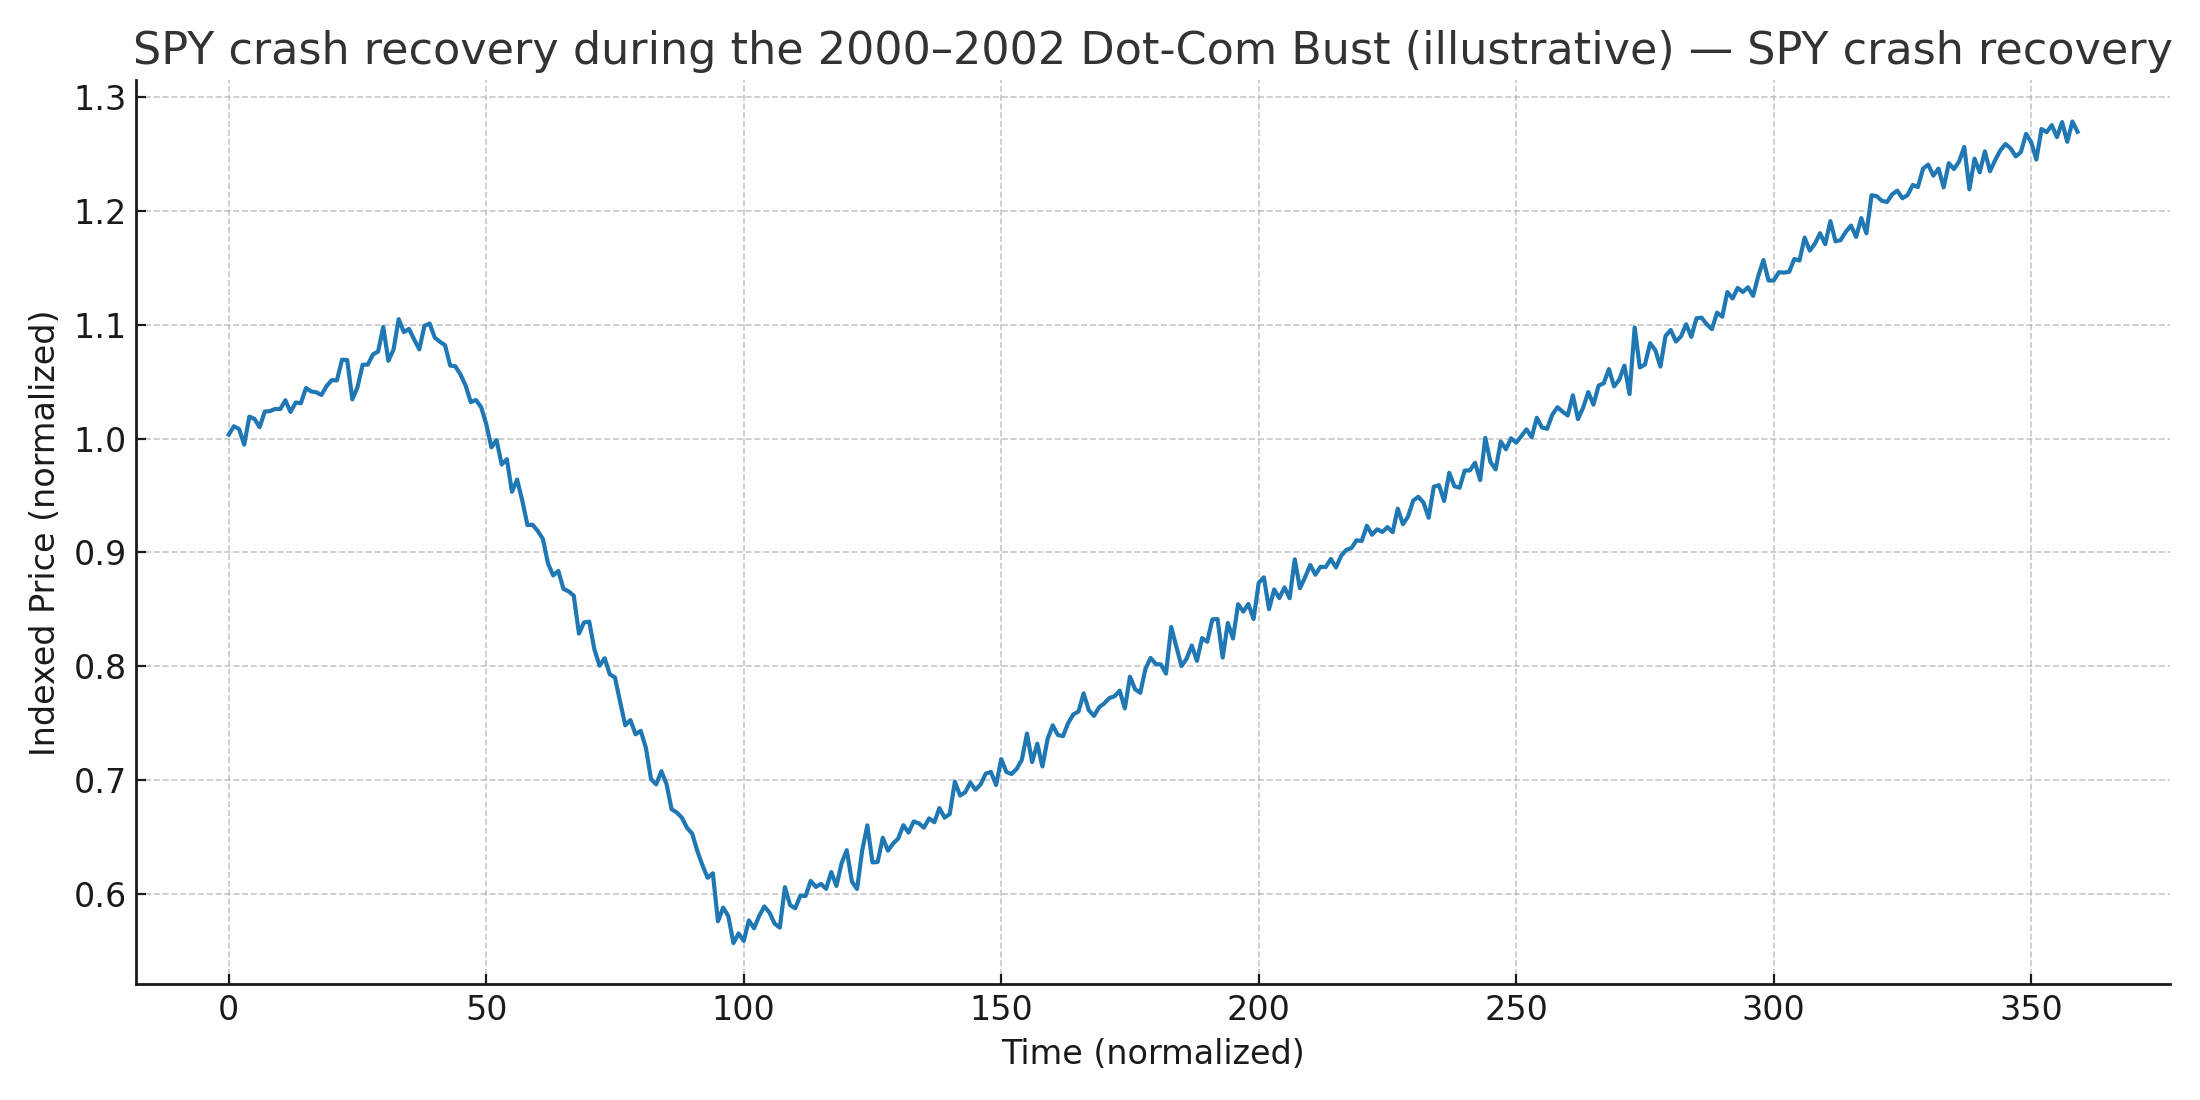
| 2000–2002 Dot‑Com Bust | Bear market | ~45–50% | Multi‑year | Prolonged declines, sector concentration risk |
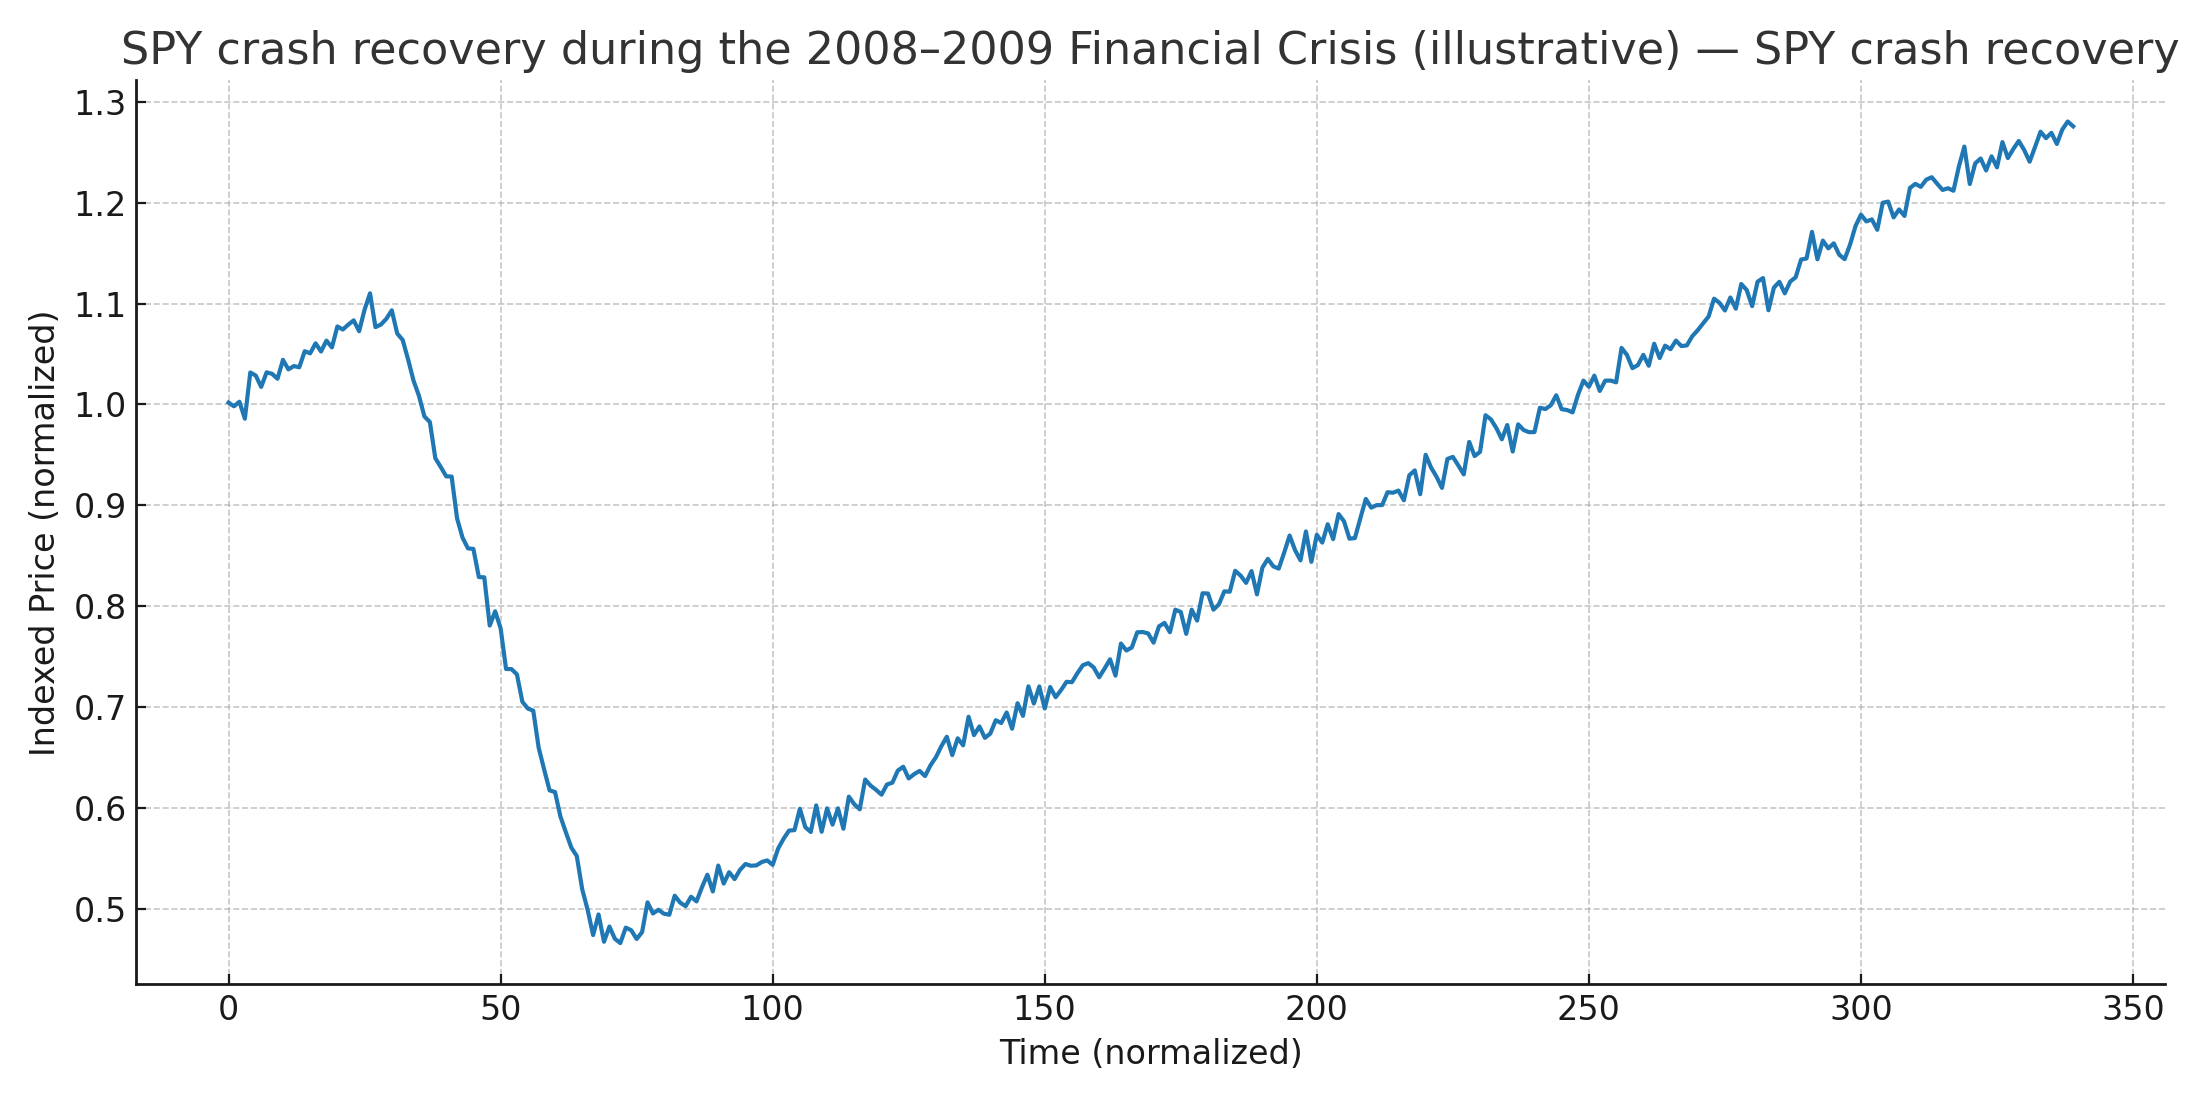
| 2008–2009 GFC | Bear market | ~55–60% | Several years | Financial system stress, unemployment spike |
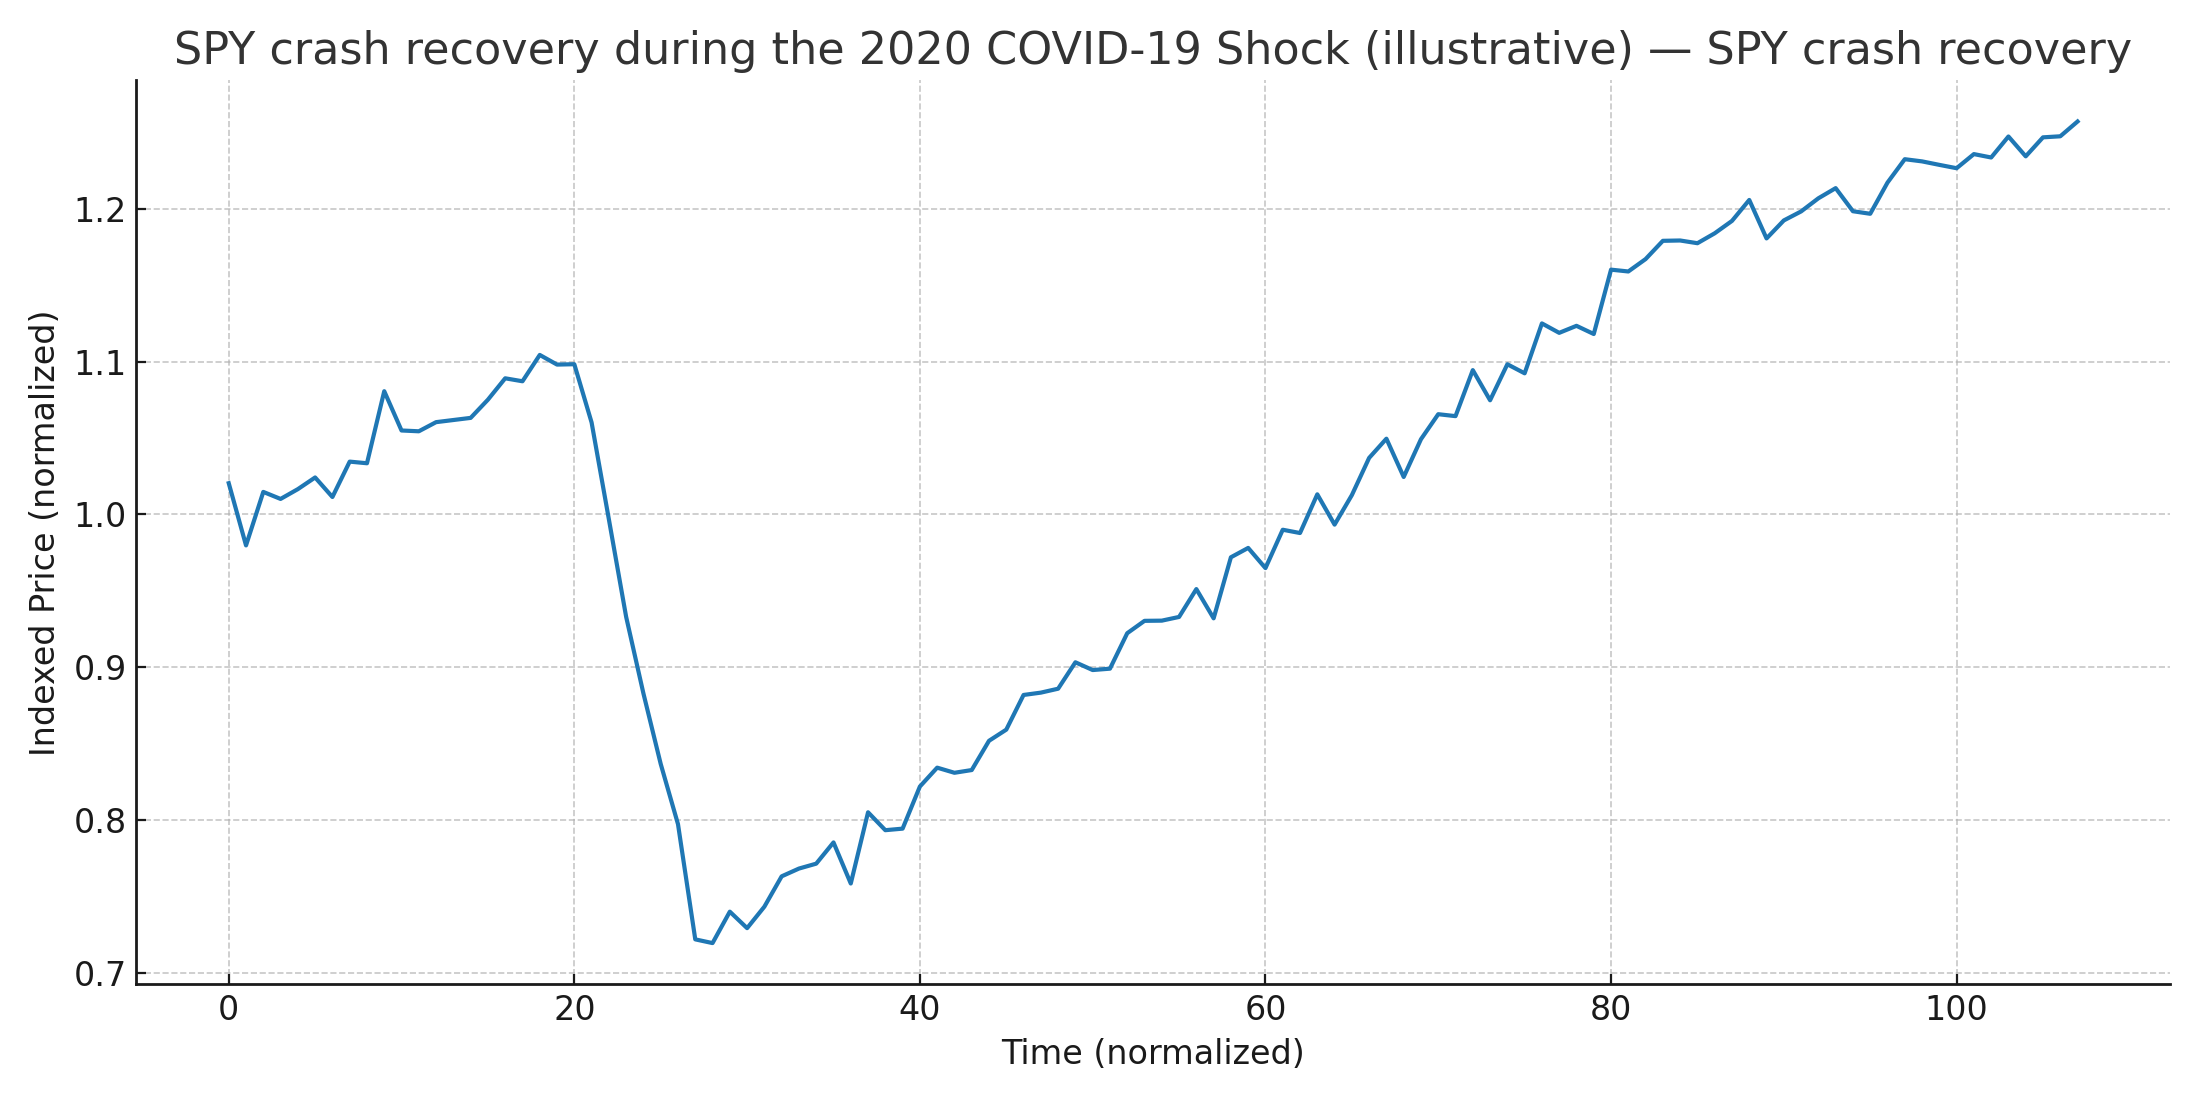
| 2020 COVID‑19 | Bear market (fast) | ~30–35% | ~Months | Uncertainty shock, liquidity crunch, rapid recovery |
Even though the patterns differ, one constant shows up: diversified equity markets have historically recovered over time. The challenge is surviving the path—financially (cash buffers, risk sizing) and emotionally (staying disciplined).
💻 2000–2002: The Dot‑Com Bust

The dot‑com era combined a technology valuation bubble with a long, grinding unwind. SPY investors experienced an extended decline with multiple failed rallies. In a marathon bear market, the psychological test is patience: most investors underestimate how long sideways‑to‑down periods can last. Dollar‑cost averaging (DCA) shines in such environments by forcing purchases near lows, lowering average cost basis without trying to time the bottom.
For lump‑sum investors who deployed capital near the peak, the wait felt interminable. Yet the long‑run outcome for diversified US equities still favored remaining invested—and reinvesting dividends. This episode underscores why time in the market (plus systematic contributions) often beats market timing, especially when bubbles burst slowly rather than via a single shock.
🏦 2008–2009: The Global Financial Crisis

The GFC featured a rapid, deep drawdown, bank failures, credit freezes, and a severe recession. For SPY holders, it was the quintessential “risk happens fast” moment. Many capitulated near the lows, locking in permanent losses. Investors who continued contributions—or at least avoided panic selling—benefited disproportionately from the subsequent recovery. Dividend reinvestment and tax‑loss harvesting (where applicable) also enhanced outcomes.
A key takeaway is that liquidity and risk sizing decide survivability. Having 3–6 months of expenses in cash and ensuring your equity allocation reflects your true drawdown tolerance helps you avoid forced selling. Add a systematic contribution plan to average in during stress, and you tilt odds toward long‑run success even through severe crises.
🦠 2020: The COVID‑19 Shock

The COVID‑19 bear market was unusually fast on both the way down and up. The rapid policy response (fiscal + monetary), alongside a tech‑heavy market structure, accelerated the rebound. For DCA investors, the window to “buy the dip” was short but powerful; for lump‑sum investors brave enough to deploy during the panic, time‑to‑recovery was surprisingly brief compared with past crises.
The lesson isn’t that every crash recovers quickly—but that having a pre‑committed plan matters. Decide in advance how you will contribute during drawdowns (e.g., continue monthly DCA, add a small “volatility boost” when markets are −20% or −30%), and automate it so emotions don’t derail execution.
📉 Recent corrections & 2022–2023 drawdowns
Between major crises, SPY has seen several corrections and sector rotations. Inflation surprises, rate hikes, and changing leadership (e.g., megacap tech vs cyclicals) created whipsaw risk. In such environments, maintaining a diversified core and sticking to contribution schedules can help mitigate regret from chasing performance. For tactical investors, tilting around edges (e.g., small style/value add‑ons) should be sized modestly and tested with historical scenarios.
Whether the decline is −10% or −20%+, a consistent rule‑set beats ad‑hoc decisions. Examples: continue DCA regardless of headlines; rebalance back to target bands; increase contributions by a preset amount after a threshold drawdown. Codifying these actions ahead of time reduces paralysis and hindsight bias when volatility spikes.
🔄 DCA vs Lump Sum During Crashes
Academic and practitioner research often finds that lump‑sum investing outperforms DCA on average in rising markets due to earlier market exposure. However, during crash windows, DCA’s behavioral and risk‑smoothing benefits can dominate for real investors, especially when the alternative is market timing (often poorly executed). The right question is less “which always wins?” and more “which can I stick to through stress without blowing up my plan?”
| Scenario | Pros | Cons | Best for |
|---|---|---|---|
| Lump Sum near a peak | Max immediate exposure if markets keep rising | Higher regret/drawdown risk if crash follows | High risk tolerance, long horizon, cash on hand |
| Lump Sum during a crash | Higher expected returns if recovery ensues | Emotionally hard to execute, timing risk | Disciplined investors with dry powder |
| Systematic DCA through crash | Averages down, rules‑based, reduces timing error | Underperforms lump sum if rebound is instant | Most investors seeking consistency |
Use our DCA Calculator to compare outcomes across contribution sizes, start dates, and crash windows. Premium users can simulate multiple portfolios, thresholds, and rebalancing rules: try Premium.
⚙️ What drives SPY recoveries after crashes?
Recoveries reflect a mix of corporate earnings normalization, policy responses (fiscal/monetary), and shifting risk appetite. Dividends and buybacks help total return, while sector composition (e.g., tech weight) influences recovery speed. Valuation resets during bears often improve forward returns; however, macro regime changes (rates, inflation) can elongate recoveries. That’s why timeline expectations should be flexible: some recoveries take months; others, years.
- Macro backdrop (rates, inflation, credit spreads)
- Earnings trajectory and margins
- Policy support intensity and duration
- Market structure: sector leadership, index concentration
- Global growth and currency effects
🧯 Risk management & timing reality
“All‑in at the bottom” is a great story, but hard to do in real time. A better approach is to predefine risk bands (max equity allocation), keep a cash buffer, and automate contributions. Optional tactics include tiered DCA boosts (e.g., add +20% contribution at −20% drawdown, +40% at −30%) and periodic rebalancing back to targets. The core objective is survivability: avoid forced selling, keep participating, and let compounding work again when recovery arrives.
Remember, the goal isn’t to predict the bottom—it’s to ensure your process is robust to not knowing. Process > prediction.
🧠 Behavior & discipline during crashes
Panic selling near lows is the #1 destroyer of long‑term returns. Use pre‑commitment devices: automatic transfers, contribution schedules, and accountability (e.g., a written IPS—Investment Policy Statement). Track progress monthly rather than daily, and contextualize drawdowns historically. If your allocation repeatedly triggers panic, lower equity exposure and increase cash/bonds until you can sleep at night.
Behavioral edge compounds just like capital. The edge is keeping a cool head when others can’t.
🛠️ Run your own SPY crash scenarios with our tools
- Investment Simulator — backtest start dates, contributions, and recovery timelines.
- DCA Calculator — visualize average cost vs market path.
- Premium — advanced scenarios: multi‑portfolio, rebalancing, fee modeling.
- WhatIfBudget — plan monthly contributions and emergency fund.
Special offers & resources:
- Open an investing account with Wealthsimple (affiliate): Start here
- Recommended reads (Amazon affiliates): The Intelligent Investor, The Psychology of Money
🎯 Key lessons from SPY crash recoveries
- Crashes differ, but diversified equity markets have historically recovered over time.
- Process beats prediction: automate contributions and rebalance.
- DCA reduces timing risk and can improve behavior through stress.
- Liquidity and risk sizing determine survivability (avoid forced selling).
- Have a written plan (IPS) and stick to it; adjust allocation if you can’t sleep.
Ready to build your plan? Use WhatIfBudget to set monthly contributions, then stress‑test your allocations in the Simulator or go further with Premium.
🔗 Continue learning
📚 References
✅ Conclusion: Build a plan that survives crashes
SPY’s history shows that while crashes are inevitable, recoveries have been the rule—not the exception. The winning investor isn’t the best forecaster but the one with a durable, rules‑based process. Define your allocation, automate contributions, rebalance, and stay the course through volatility.
❓ FAQ
How long does SPY usually take to recover from a crash?
It varies widely. Some rebounds take months (e.g., rapid policy‑driven recoveries), others take years (e.g., prolonged de‑rating cycles). Plan for uncertainty; design contributions and rebalancing rules you can stick to.
Is DCA always better than lump sum during crashes?
No strategy wins in every path. DCA reduces timing risk and improves behavior during stress. Lump sum during deep drawdowns can outperform if recovery follows, but it is emotionally hard and timing‑sensitive.
Should I adjust my contributions during a bear market?
If your income and emergency fund allow, consider pre‑defined “boosts” at drawdown thresholds (e.g., −20%, −30%). Keep boosts small enough to maintain flexibility and avoid forced selling later.