DCA vs Lump Sum: When One Clearly Wins
A practical, data-aware framework for deciding whether to invest all at once, average in over time, or use a hybrid approach based on risk, valuation, behavior, taxes, and cash flow.
Markets trend upward, your time horizon is long, valuations are reasonable, and you can emotionally tolerate an immediate drawdown.
You face high uncertainty, stretched valuations, major regret risk, or need a system that keeps you investing calmly.
Investing part now and phasing the rest over several months can balance expected return with emotional comfort.
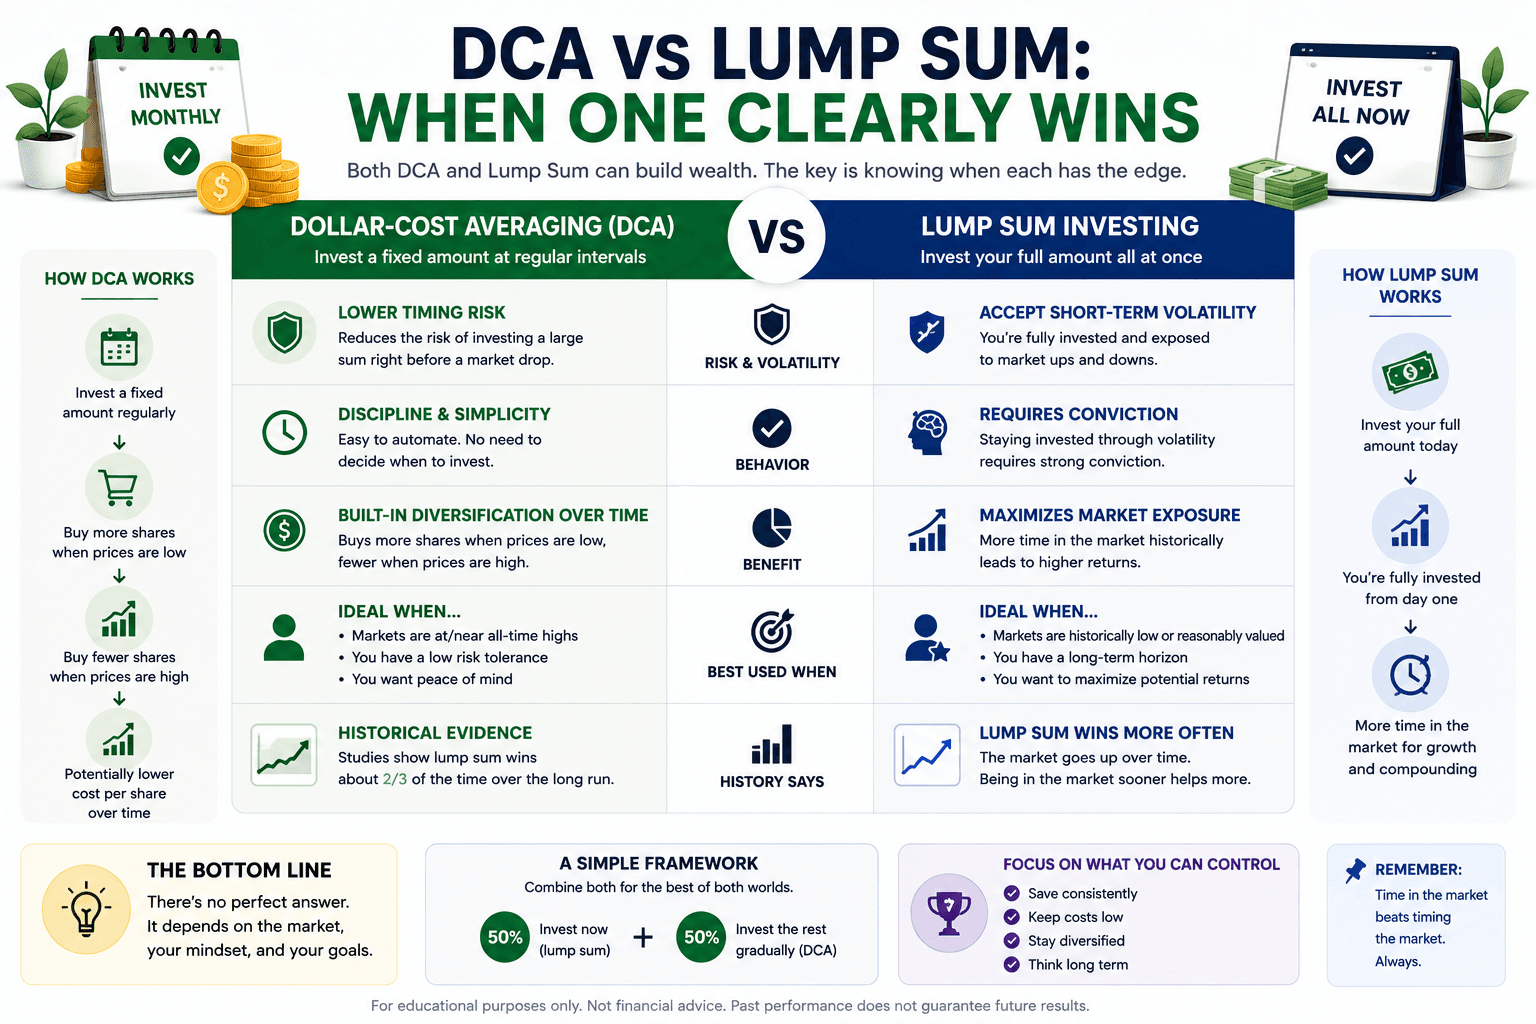
Quick Verdict: DCA vs Lump Sum
Lump sum investing often has the higher expected return because markets have historically risen more often than they have fallen over long periods. If you already have the cash and your goal is long-term growth, investing it sooner gives more money more time in the market.
But the highest expected return is not always the best real-world strategy. DCA can win when it prevents panic, regret, or decision paralysis. It can also reduce the damage of investing immediately before a sharp decline. The right strategy depends on the investor, not only the spreadsheet.
Lump Sum
Best when you can handle volatility and want maximum market exposure immediately.
DCA
Best when behavioral discipline, sequence risk, and uncertainty matter more than theoretical optimization.
DCA and Lump Sum Defined
Lump sum investing means investing the full available amount immediately. If you receive a bonus, inheritance, business sale proceeds, or cash sitting on the sidelines, lump sum puts that money to work right away. The benefit is maximum exposure to long-term growth. The risk is that the market can fall immediately after you invest.
Dollar-cost averaging, or DCA, means splitting the investment into scheduled installments. Instead of investing $12,000 today, you might invest $1,000 per month for 12 months. This spreads entry prices across time. When prices fall, later installments buy more shares. When prices rise, later installments buy fewer shares.
There are two different situations people often mix together. The first is a true windfall decision: you already have cash and must decide how fast to deploy it. The second is normal monthly investing: you do not have a lump sum, but you invest from every paycheck. Monthly investing from cash flow is naturally DCA, and it is not inferior. It is simply how most people build wealth.
What the Math Says
The mathematical case for lump sum is straightforward. If markets tend to rise over time, waiting to invest part of your cash creates an opportunity cost. Money kept in cash may earn interest, but it is not fully participating in stock-market growth. Over long periods, the market’s positive expected return tends to reward earlier investment.
However, averages hide sequence risk. If you invest right before a steep drop, the emotional experience can be brutal. Even if the portfolio later recovers, the investor may not stay invested long enough to benefit. A strategy that is optimal on paper but impossible to follow is not actually optimal for that person.
| Factor | Lump sum advantage | DCA advantage |
|---|---|---|
| Expected return | Usually higher when markets trend upward. | Can lag if markets rise quickly during the DCA window. |
| Timing risk | Fully exposed immediately. | Spreads entry points across time. |
| Behavior | Requires confidence and emotional tolerance. | Can reduce regret and panic risk. |
| Implementation | Simple one-time decision. | Requires a schedule and follow-through. |
| Best use | Long time horizon, stable investor, reasonable valuations. | Uncertain markets, anxious investor, large windfall, high regret risk. |
The real answer is not “lump sum always” or “DCA always.” The real answer is: lump sum tends to maximize exposure, while DCA manages regret and sequence risk. The better strategy is the one you can execute without abandoning the plan.
When Lump Sum Clearly Wins
Lump sum clearly wins when the market rises soon after the investment and continues compounding. In that environment, cash left outside the market becomes a drag. Every DCA installment that waits on the sidelines misses part of the early rise.
This is why lump sum can be especially attractive for investors with long time horizons. If you are investing for retirement decades away, the first few months may matter less than the total time invested. A long-term investor who can tolerate volatility may rationally choose to deploy cash immediately and avoid overthinking the entry point.
Lump sum fits if...
- You have a long investment horizon.
- You already have an emergency fund.
- You can tolerate a sudden drawdown.
- Your asset allocation is already chosen.
- You want simplicity and maximum exposure.
Be careful if...
- You may need the money soon.
- A drop would make you sell.
- You are investing into a very concentrated asset.
- You are using borrowed money.
- You do not understand the investment.
Lump sum does not mean reckless investing. It still requires a suitable asset allocation. A lump sum into a diversified ETF portfolio is different from a lump sum into one speculative stock. The first is a disciplined allocation decision. The second may simply be concentrated timing risk.
When DCA Clearly Wins
DCA clearly wins when a bad early sequence would cause emotional or financial damage. If investing all at once would keep you awake at night, the theoretical advantage of lump sum may not be worth it. DCA allows you to participate gradually while reducing the chance of immediate regret.
DCA can also work well when valuations feel stretched, volatility is high, or your confidence is low. Instead of requiring a perfect entry decision, it turns the investment into a plan. You decide the schedule in advance and keep following it unless your life circumstances change.
| Situation | Why DCA may help | Possible approach |
|---|---|---|
| Large inheritance or bonus | Reduces regret from investing everything before a decline. | Deploy over 6 to 12 months. |
| High market volatility | Spreads purchases through uncertain prices. | Use fixed dates and avoid changing the plan emotionally. |
| Anxious investor | Improves ability to stay invested. | Use smaller tranches and automate buys. |
| Unclear asset allocation | Buys time to finalize the long-term plan. | Invest core allocation first, then complete the rest gradually. |
The biggest danger with DCA is turning it into market timing. A DCA plan should have a start date, schedule, and end date. If you keep delaying each installment because the market “feels expensive,” you are no longer dollar-cost averaging. You are sitting in cash while calling it discipline.
The Hybrid Strategy: Often the Best Real-World Answer
A hybrid strategy invests part of the money immediately and averages the rest over time. For example, you might invest 50% today and spread the remaining 50% over six months. This is not mathematically pure, but it is often psychologically elegant.
The hybrid approach acknowledges two truths at once. First, markets usually reward time invested, so putting some money to work now makes sense. Second, sequence risk is real, so holding back part of the cash can reduce regret if markets fall soon after the first purchase.
| Hybrid model | Who it may fit | Tradeoff |
|---|---|---|
| 50% now, 50% over 6 months | Balanced investor with moderate regret risk. | Good compromise between exposure and comfort. |
| 70% now, 30% over 3 months | Confident investor who still wants a buffer. | Closer to lump sum, less cash drag. |
| 25% now, 75% over 12 months | Nervous investor or very large windfall. | More comfort, but more opportunity cost if markets rise. |
The hybrid approach can also help couples make decisions. One partner may prefer full lump sum, while the other worries about a crash. A structured hybrid reduces conflict because the plan gives both return potential and emotional protection.
Case Studies: Bull Markets, Crashes, and Sideways Markets
The winner depends heavily on what happens immediately after the first investment date. In a strong bull market, lump sum usually gets ahead quickly. In a crash right after entry, DCA can look brilliant because later installments buy lower prices. In a sideways market, the difference may be small and behavior may matter more than the final number.
| Market environment | Likely winner | Why |
|---|---|---|
| Fast rising market | Lump sum | More money participates from the beginning. |
| Immediate crash then recovery | DCA often looks better | Later buys occur at lower prices. |
| Choppy sideways market | Depends | DCA may smooth entries, but final result can be close. |
| Long bear market | DCA may reduce pain | Cash is deployed gradually as prices decline. |
| Long-term multi-decade period | Lump sum often has an edge | Time in market tends to dominate short entry timing. |
This is why tools matter. You can test historical scenarios with the Investment Simulator and model recurring contributions with the DCA Calculator. The goal is not to predict the next market path perfectly. The goal is to understand how each strategy behaves in different paths.
How to Test the Decision Before You Commit
The cleanest way to choose between DCA and lump sum is to test the decision as a scenario, not as a slogan. Start with the amount of cash available, the asset or portfolio you plan to buy, and the time horizon. Then run at least three versions: all at once, equal monthly installments, and a hybrid plan that invests part now and phases in the rest.
The output should not only rank final value. It should show drawdown, worst year, recovery time, and how much cash stayed uninvested during the DCA window. This makes the tradeoff visible. Lump sum may win by final value but create a sharper early drawdown. DCA may feel safer but leave more cash on the sidelines if the market rises quickly.
| Scenario to run | What it reveals | Decision signal |
|---|---|---|
| 100% lump sum today | Maximum exposure and maximum immediate timing risk. | Best if final value advantage is large and drawdown is tolerable. |
| Monthly DCA over 6 to 12 months | Regret reduction and slower market entry. | Best if behavior risk is high or early drawdown would cause panic. |
| Hybrid plan | Partial exposure with partial regret protection. | Best if the investor wants a rule both partners can follow. |
This is where the article connects directly to the WhatIfInvested product workflow: learn the tradeoff here, model the cash-flow version in the DCA Calculator, then use the simulator or Premium tools when the decision involves several portfolios, benchmarks, fees, saved scenarios, or export-ready reports.
Risk, Drawdowns, and Regret
Drawdown is the peak-to-trough decline in portfolio value. It matters because investors do not experience returns as smooth averages. They experience account balances moving up and down in real time. A strategy with higher expected return can still fail if its drawdowns cause bad decisions.
Lump sum exposes the full amount immediately. That is powerful in rising markets, but painful if the market falls right away. DCA reduces early exposure, so initial losses may feel smaller. This can make it easier for some investors to stay committed.
Financial risk
The chance that the portfolio falls, underperforms, or does not meet the goal within the needed timeline.
Behavior risk
The chance that the investor abandons the strategy, sells low, pauses contributions, or keeps waiting forever.
Behavior risk is often underestimated. A spreadsheet assumes the investor follows the plan. Real investors have memories, fears, families, headlines, and emotions. If DCA keeps someone invested who would otherwise panic, DCA can be the better strategy even if lump sum had a higher theoretical expected return.
Account, Tax, and Cash Flow Considerations
Taxes can influence the choice. Inside tax-advantaged accounts, DCA is operationally simpler because each small purchase does not create complex taxable record-keeping. In taxable accounts, many small purchases can create more tax lots to track, although modern brokerages often handle much of this reporting.
For Canadian investors, account choice can matter before strategy choice. A TFSA, RRSP, or FHSA may change the after-tax outcome. For US investors, traditional and Roth retirement accounts create different tradeoffs. The key is to choose the right account first, then decide how quickly to invest inside it.
| Question | Why it matters | Useful next step |
|---|---|---|
| Do I need the cash soon? | Short-term money should not usually be in volatile assets. | Keep short-term reserves separate. |
| Which account should I use? | Tax treatment can change the real outcome. | Read TFSA vs RRSP vs FHSA. |
| Can my budget support investing? | Monthly DCA works only if cash flow is reliable. | Use WhatIfBudget. |
| What will I buy? | The strategy depends on a suitable portfolio. | Review Top ETFs for Monthly DCA. |
A Practical Decision Workflow
- Separate emergency cash from investment cash. Do not invest money needed for bills, taxes, or near-term goals.
- Choose the account. Decide whether the money belongs in a retirement account, tax-free account, first-home account, or taxable brokerage.
- Pick the target portfolio. Decide on ETFs, asset allocation, and risk level before timing the investment.
- Score your behavior risk. If a sudden 15% drop would make you sell, avoid full lump sum.
- Choose lump sum, DCA, or hybrid. Match the strategy to both math and temperament.
- Write the rule down. A DCA plan needs dates and amounts. A lump-sum plan needs a no-panic commitment.
- Review only on schedule. Do not let daily market moves rewrite a long-term strategy.
Common Mistakes That Make Both Strategies Fail
The biggest mistake is treating DCA vs lump sum as a way to predict the next few months. Neither strategy gives you a crystal ball. Lump sum can lose money immediately, and DCA can underperform if markets rise quickly. The goal is not certainty. The goal is choosing a process that matches your finances and behavior.
- Changing the plan midstream: if you choose DCA, do not cancel scheduled buys every time the news feels scary.
- Investing money needed soon: neither lump sum nor DCA fixes a bad time horizon. Short-term cash should stay separate.
- Using the wrong portfolio: timing strategy matters less than owning a suitable mix of stocks, bonds, cash, and ETFs.
- Confusing fear with strategy: delaying forever is not DCA. It is market timing without a rule.
- Ignoring taxes and fees: frequent purchases can create more records, especially in taxable accounts.
A good strategy should be written before the market tests you. Decide the amount, account, portfolio, schedule, and review date in advance. That small act of structure can prevent emotional decisions later.
Frequently Asked Questions
Is lump sum investing always better than DCA?
No. Lump sum often has a higher expected return because money is invested sooner, but DCA can be better when it reduces panic, regret, or the impact of an immediate market decline.
How long should I dollar-cost average a lump sum?
Common DCA windows range from 3 to 12 months. Shorter windows reduce cash drag, while longer windows may feel more comfortable for anxious investors or very large windfalls.
Is a hybrid strategy a good idea?
Yes, for many real investors. Investing part now and phasing the rest over time can balance expected return with emotional comfort.
Should I DCA into ETFs every month?
If you invest from regular income, monthly ETF DCA can be a strong system. The key is using diversified, low-cost funds and staying consistent.
What if the market crashes after I invest a lump sum?
That is the main risk of lump sum. A suitable asset allocation, long time horizon, and emergency fund can help you avoid panic selling.
Can DCA become market timing?
Yes. If you keep delaying scheduled purchases because of headlines or fear, the plan has turned into discretionary market timing.
Which strategy is better for retirement investing?
If you already have a lump sum and a long retirement horizon, lump sum may have an expected-return edge. If you invest from each paycheck, regular DCA is natural and effective.
Should beginners use DCA?
DCA can be excellent for beginners because it builds the investing habit and reduces pressure to pick the perfect entry date.
Trusted External Resources
For additional educational context, these resources explain DCA and long-term investing concepts: