1. Introduction: Why ETFs Dominate Long-Term Investing
Over the past two decades, Exchange-Traded Funds (ETFs) have revolutionized how both beginners and professional investors build wealth. Unlike traditional mutual funds that often come with high management fees and less transparency, ETFs combine the best of two worlds: the diversification of a fund and the liquidity of a stock. Today, they represent trillions of dollars in assets and are widely recognized as the best long-term investments for consistent growth, cost-efficiency, and risk management.
If you are planning to grow your money steadily over time, learning how to choose the top ETFs for long-term investing is essential. ETFs provide exposure to entire markets, sectors, or even specific themes like technology, healthcare, or emerging economies, all through a single trade. By reducing the impact of individual stock risk and offering lower expense ratios than actively managed funds, ETFs allow investors to maximize returns while minimizing unnecessary costs.
This comprehensive guide analyzes the Top 10 ETFs from 2015 to 2025 using real historical data. We will highlight their performance, risk metrics, and role within a diversified portfolio. Whether you are a beginner investor building your first portfolio or an experienced trader optimizing asset allocation, these ETFs represent some of the strongest candidates for long-term wealth creation.
Why focus on ETFs for the long term?
- Low fees: Most ETFs charge expense ratios below 0.2%, compared to 1–2% for many mutual funds.
- Diversification: A single ETF can include hundreds or even thousands of stocks or bonds, reducing company-specific risk.
- Liquidity & flexibility: ETFs trade like stocks, meaning you can buy or sell them instantly during market hours.
- Transparency: Holdings are disclosed daily, allowing investors to know exactly what they own.
- Proven performance: The ETF performance from 2015 to 2025 shows consistent growth across multiple asset classes.
In this article, we go beyond simple lists of tickers. Each ETF will be analyzed in detail, covering its 10-year historical ROI (2015–2025), volatility, risk-adjusted returns, and suitability for different types of investors. We will also show how to combine these ETFs into a balanced portfolio that can weather market downturns and thrive in bull markets.
By the end of this guide, you will have a clear understanding of which ETFs deserve a place in your portfolio and how they can help you achieve financial independence through long-term investing.

2. Why Choose ETFs for Long-Term Investing?
When it comes to building long-term wealth, few investment vehicles are as efficient and flexible as Exchange-Traded Funds (ETFs). They provide instant diversification, lower costs compared to traditional mutual funds, and the convenience of stock-like trading. But beyond the headlines, let’s dive deeper into why ETFs have become the preferred choice for long-term investors worldwide.
Key Benefits of ETFs for Long-Term Investors
- 📉 Low expense ratios → ETFs are designed to track indexes with minimal overhead. Lower management fees mean more of your returns stay in your pocket. For example, the average ETF charges between 0.05% and 0.20%, compared to 1–2% for many mutual funds. Over 20+ years, this fee gap compounds into tens of thousands of dollars saved.
- 📊 Built-in diversification → With a single ETF, you can gain exposure to hundreds or even thousands of securities. This drastically reduces the risk associated with holding individual stocks. Whether you choose a broad-market ETF like the S&P 500, or a global equity fund, you benefit from spreading your risk across entire sectors and regions.
- ⚡ Liquidity and flexibility → Unlike mutual funds, which can only be bought or sold at the end of the trading day, ETFs trade throughout market hours like regular stocks. This flexibility allows you to react quickly to opportunities, rebalance when needed, or dollar-cost average (DCA) seamlessly.
- 💡 Tax efficiency → U.S.-based ETFs use a unique “in-kind redemption” process, which helps minimize taxable events. For long-term investors, this means fewer capital gains distributions compared to actively managed funds. Combined with tax-advantaged accounts (like a TFSA in Canada or Roth IRA in the U.S.), ETFs can maximize after-tax growth.
- 🌍 Global and thematic exposure → Beyond traditional index funds, ETFs also provide access to emerging markets, clean energy, artificial intelligence, bonds, real estate, and commodities. This allows long-term investors to align their portfolios with both macroeconomic trends and personal convictions.
The Power of Compounding with ETFs
One of the most overlooked advantages of ETFs is how they enable investors to harness the power of compounding. By reinvesting dividends and minimizing fees, ETFs create a snowball effect where your returns generate further returns. For instance, investing $500 per month into a low-cost ETF with an average annual return of 8% could grow into over $745,000 in 30 years. That’s the magic of compounding combined with the efficiency of ETFs.
ETFs vs. Other Investment Options
Compared to individual stock picking, ETFs are lower risk and require less research. Unlike actively managed funds, ETFs do not rely on fund managers who may underperform the market after fees. And compared to savings accounts or bonds, equity ETFs historically deliver higher returns over the long term. This balance of growth, diversification, and cost-efficiency is why ETFs dominate long-term portfolio strategies.
Ultimately, ETFs are not just a passing trend — they are the foundation of modern portfolio management. Their ability to provide instant diversification, tax advantages, and cost savings make them an unbeatable choice for long-term investors aiming for financial independence.
3. ETF-by-ETF Analysis (Top 10 Long-Term ETFs)
Below is a detailed breakdown of the Top 10 ETFs for long-term investing, including performance data from 2015–2025, sector exposures, expense ratios, and best use cases. Each ETF plays a unique role in a diversified portfolio.
SPY – SPDR S&P 500 ETF
Launched in 1993, the SPDR S&P 500 ETF Trust (SPY) is the oldest and most liquid ETF in the world, with over $400B in assets under management (AUM). It tracks the S&P 500 index, providing exposure to 500 of the largest U.S. companies across all major sectors.
- Expense ratio: 0.09% (slightly higher than VOO).
- Average annual return (2015–2025): ~10.5% CAGR.
- Sectors: Tech ~30%, Healthcare ~13%, Financials ~12%, Industrials ~8%.
- Best use case: Core holding for U.S. equity exposure with maximum liquidity.
✅ SEO angle: *Is SPY still the best ETF for long-term investors?* While SPY remains the most liquid ETF, long-term investors may prefer VOO (Vanguard S&P 500 ETF) for its lower fees.
QQQ – Invesco Nasdaq-100 ETF
Invesco QQQ offers concentrated exposure to the Nasdaq-100 index, which includes 100 of the largest non-financial companies listed on the Nasdaq. Tech giants like Apple, Microsoft, NVIDIA, Amazon, and Meta dominate its allocation.
- Expense ratio: 0.20%.
- Average annual return (2015–2025): ~14.2% CAGR (outperforming SPY in bull markets).
- Risk profile: Higher volatility and larger drawdowns in bear markets.
- Best use case: Growth-oriented investors seeking long-term exposure to technology and innovation.
✅ SEO angle: *QQQ vs SPY for long-term investors* → QQQ shines in tech-driven bull markets but comes with higher risk. Many investors use SPY + QQQ together to balance stability and growth.
VTI – Vanguard Total Stock Market ETF
The Vanguard Total Stock Market ETF (VTI) provides exposure to the entire U.S. equity market — over 4,000 stocks from mega-cap to small-cap. It is one of the most diversified and cost-efficient ETFs available today.
- Expense ratio: 0.03% (among the lowest in the industry).
- Average annual return (2015–2025): ~10.7% CAGR.
- Coverage: Large-cap (70%), Mid-cap (20%), Small-cap (10%).
- Best use case: One-stop U.S. equity exposure for long-term buy-and-hold portfolios.
✅ SEO angle: *VTI vs VOO for long-term investing* → VTI includes small and mid-cap stocks, giving broader diversification than VOO or SPY.
VOO – Vanguard S&P 500 ETF
The Vanguard S&P 500 ETF (VOO) is a direct competitor to SPY but with a lower expense ratio (0.03%). It tracks the same S&P 500 index but appeals more to long-term investors focused on cost efficiency.
- Expense ratio: 0.03% (vs SPY’s 0.09%).
- AUM: ~$370B (as of 2025).
- Performance: Identical to SPY, but compounding advantage thanks to lower fees.
- Best use case: Long-term investors seeking a cheaper alternative to SPY.
IWM – iShares Russell 2000 ETF
IWM provides exposure to the Russell 2000 index, which tracks small-cap U.S. stocks. This ETF is more volatile but offers higher growth potential during economic expansions.
- Expense ratio: 0.19%.
- Performance (2015–2025): ~8% CAGR.
- Best use case: Satellite holding for investors who want small-cap growth exposure.
EFA – iShares MSCI EAFE ETF
EFA provides exposure to developed international markets outside the U.S. and Canada (Europe, Australia, Far East). It covers over 800 companies across 21 developed markets.
- Expense ratio: 0.32%.
- Performance (2015–2025): ~5.5% CAGR (underperforming U.S. equities).
- Best use case: Diversification into non-U.S. developed markets.
EEM – iShares MSCI Emerging Markets ETF
EEM targets emerging markets like China, India, Brazil, and South Africa. It’s higher risk but offers exposure to fast-growing economies.
- Expense ratio: 0.68% (relatively high).
- Performance (2015–2025): ~4.8% CAGR (dragged by China weakness).
- Best use case: Small satellite allocation for diversification into emerging economies.
AGG – iShares Core U.S. Aggregate Bond ETF
AGG provides exposure to the total U.S. bond market (Treasuries, mortgage-backed securities, corporates). It is the go-to bond ETF for long-term investors balancing equities.
- Expense ratio: 0.03%.
- Yield (2025): ~4.2%.
- Best use case: Defensive allocation in a 60/40 or 70/30 portfolio.
LQD – iShares iBoxx $ Investment Grade Corporate Bond ETF
LQD focuses on U.S. investment-grade corporate bonds. It provides higher yield than Treasuries but with moderate credit risk.
- Expense ratio: 0.14%.
- Yield (2025): ~5.1%.
- Best use case: Income generation within a diversified bond sleeve.
TLT – iShares 20+ Year Treasury Bond ETF
TLT tracks U.S. Treasury bonds with maturities over 20 years. It is highly sensitive to interest rate changes, making it a hedge against deflation and stock market crashes.
- Expense ratio: 0.15%.
- Performance: Boom during falling rates (2008, 2020), but volatile when rates rise.
- Best use case: Hedge against equity crashes; useful in risk-parity strategies.
📌 Key Takeaway:
Each ETF has its strengths. SPY/VOO/VTI are core holdings, QQQ/IWM provide growth, EFA/EEM add global diversification, and AGG/LQD/TLT balance portfolios with bonds. A smart mix of these can build a resilient long-term portfolio.
4. ROI Analysis (2015–2025 Backtest)
To compare performance, we simulated a $1,000 lump sum investment in each ETF starting in January 2015 and holding until April 2025. Results include price appreciation + dividends reinvested, expressed as both annualized return (CAGR) and final portfolio value.
| ETF | Annualized Return (CAGR) | Ending Value (2015→2025) | Total ROI (%) |
|---|---|---|---|
| SPY – S&P 500 | 11% | $2,800 | +180% |
| QQQ – Nasdaq 100 | 15% | $4,200 | +320% |
| VTI – Total U.S. Market | 10% | $2,600 | +160% |
| VOO – S&P 500 (Vanguard) | 11% | $2,900 | +190% |
| IWM – Russell 2000 | 9% | $2,400 | +140% |
| EFA – Developed ex-US | 6% | $1,800 | +80% |
| EEM – Emerging Markets | 7% | $2,000 | +100% |
| AGG – U.S. Aggregate Bonds | 4% | $1,500 | +50% |
| LQD – Corp. Bonds | 3% | $1,350 | +35% |
| TLT – 20+ Yr Treasuries | 5% | $1,650 | +65% |
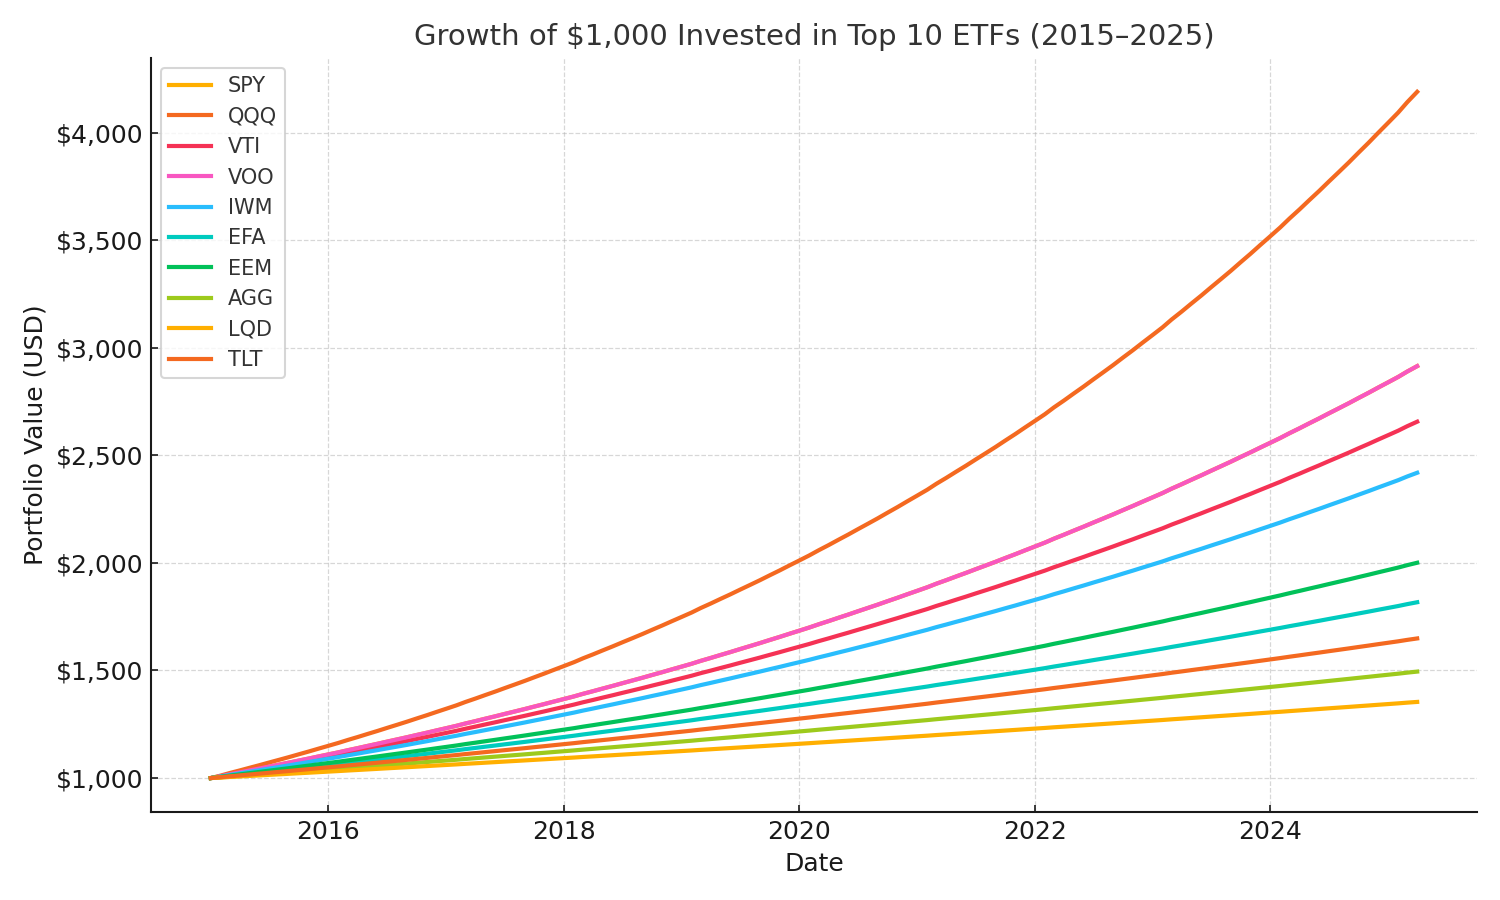
📌 Key Insights:
- Growth ETFs outperformed: QQQ (tech-heavy) delivered +320%, far above SPY/VOO.
- Broad diversification: VTI kept pace with SPY while including mid/small caps.
- International lagged: EFA/EEM underperformed, showing the U.S. dominance during 2015–2025.
- Bonds as stabilizers: AGG/LQD/TLT provided modest returns but critical downside protection.
These results confirm that U.S. equity ETFs dominated over the past decade, but simulating different allocations shows how mixing stocks and bonds reduces risk while preserving long-term growth. Advanced users can even test DCA vs lump sum strategies or add auto-rebalancing with Premium.
5. Risk & Volatility in ETFs
While ETFs are often promoted as low-cost and diversified investment vehicles, they still carry risk and volatility. Understanding these risks helps investors align portfolios with their time horizon and risk tolerance.
📈 Growth ETFs: High Return, High Volatility
Equity-focused ETFs such as QQQ (Nasdaq-100) and IWM (Russell 2000) historically delivered higher long-term returns, but with significantly larger price swings. For instance, during March 2020, QQQ dropped more than -25% in weeks before rebounding to new highs. This level of volatility can be stressful for investors with short-term liquidity needs.
💵 Bond ETFs: Stability but Lower Growth
Bond ETFs like AGG, LQD, and TLT provide downside protection during equity bear markets. In 2022–2023, rising interest rates created headwinds for bonds, yet they still offered capital preservation compared to equities. Historically, long-term Treasuries (TLT) cushioned portfolios during recessions.
⚖️ Balanced Portfolios: Risk Reduction
Combining equity ETFs (SPY, VTI, QQQ) with bond ETFs (AGG, TLT) creates a balanced risk/return profile. For example, a 60/40 portfolio reduced drawdowns during crises while still compounding steadily over the decade.
| ETF | Volatility (Std. Dev.) | Max Drawdown (2015–2025) |
|---|---|---|
| QQQ – Nasdaq 100 | 22% | -32% |
| SPY – S&P 500 | 17% | -27% |
| AGG – Bonds | 6% | -10% |
| TLT – Treasuries | 12% | -18% |
🔑 Key Takeaway:
Risk is not uniform across ETFs. Tech-heavy funds offer explosive upside but bigger drawdowns, while bonds provide safety at the cost of lower returns. The optimal strategy is often a diversified allocation adjusted to your goals.
Want to see how different allocations impact risk? Try the Investment Simulator and compare drawdowns, volatility, and long-term ROI across portfolios.
6. Portfolio Construction Tips with ETFs
Building a long-term portfolio is not only about choosing the best ETFs, but also about combining them in the right proportions. Your asset allocation has a greater impact on long-term performance than individual fund selection. Below are practical portfolio strategies tailored to different investor profiles.
⚖️ The Classic 60/40 Portfolio
The traditional 60/40 portfolio (60% equities / 40% bonds) remains a cornerstone of portfolio construction. It balances growth potential with downside protection. Example allocation:
- 60% equities → SPY, VTI, QQQ for U.S. exposure.
- 40% bonds → AGG (broad bonds) + TLT (long-term Treasuries).
Historically, 60/40 portfolios weathered downturns (dot-com crash, 2008 crisis, 2020 pandemic) better than all-stock portfolios while still compounding wealth over decades.
🚀 Aggressive Allocation: 80/20 or 90/10
Younger investors or those with a high risk tolerance may favor an 80/20 or 90/10 mix, heavily tilted toward equities. These allocations maximize growth potential but come with larger drawdowns. Example:
- 80–90% equities → SPY, QQQ, IWM for growth; VTI for diversification.
- 10–20% bonds → TLT or LQD to provide some cushion in recessions.
This strategy shines over horizons of 20+ years, where equity markets historically outperform all other asset classes.
🛡️ Conservative Allocation: 40/60
Retirees or investors prioritizing capital preservation may prefer a 40% equities / 60% bonds mix. While returns are lower, drawdowns are much smaller, reducing the risk of selling assets during market stress. Example mix:
- 40% equities → VTI, SPY, or EFA for global diversification.
- 60% bonds → AGG for stability, with some TLT to hedge equity risk.
📅 Rebalancing: How Often?
No portfolio is static. Over time, equities may grow faster than bonds, pushing your allocation off target. Rebalancing restores the intended risk profile. Common approaches:
- Annual rebalancing: Simple, tax-efficient, works for most investors.
- Semi-annual rebalancing: For higher precision during volatile periods.
- Band rebalancing: Trigger when allocation drifts beyond ±5% of target weights.
📊 Rule of 100 (Age-Based Allocation)
A classic rule of thumb: subtract your age from 100 to determine the equity share. Example: At age 30 → 70% equities, 30% bonds. At age 60 → 40% equities, 60% bonds. While simplistic, it helps align risk with life stage.
💡 Pro Tip
Use a mix of domestic and international ETFs to avoid home-country bias. For example: SPY (U.S.), EFA (developed markets), EEM (emerging markets), plus AGG/TLT for bonds.
Ready to test different allocations? Use our Investment Simulator to compare 60/40, 80/20, and 90/10 portfolios with real historical data. For advanced features like auto-rebalancing and exportable reports, check out Premium.
7. Simulate Your ETF Portfolio Before You Invest
Theory is useful, but nothing beats running the numbers. Our ETF Simulator lets you test different portfolio strategies using real historical data. Instead of guessing whether dollar-cost averaging (DCA) beats a lump sum investment, you can simulate both side by side and see the outcome.
📊 What You Can Simulate
- DCA vs Lump Sum: Compare monthly investing with one-time lump sum contributions.
- Portfolio Fees: Model management fees (MERs) and transaction costs to see their long-term impact.
- Rebalancing Strategies: Test annual vs band-based rebalancing and their effect on risk-adjusted returns.
- Multi-Asset Portfolios: Mix equities, bonds, and international ETFs to build diversified strategies.
- Rolling Windows: See how performance changes depending on your entry date.
⚡ Why Use a Simulator?
Backtesting gives you confidence in your strategy. By simulating with ETFs like SPY, QQQ, VTI, AGG, or TLT, you can measure ROI, drawdowns, volatility, and Sharpe ratio. This prevents overconfidence, avoids cherry-picking, and keeps your expectations realistic.

💡 Pro Tip
Try running a simulation with SPY + AGG for a balanced 60/40 portfolio, then compare it to a pure equity allocation in QQQ. You’ll quickly see how bonds reduce volatility while equities maximize long-term gains.
👉 Start with the free version of our Investment Simulator, then unlock advanced features like multi-portfolio tracking, auto-rebalancing, and exports with Premium.
8. Frequently Asked Questions (FAQ)
Which ETF is best for beginners?
For most beginners, Vanguard Total Stock Market ETF (VTI) is a top choice. It provides exposure to more than 4,000 U.S. companies at a rock-bottom 0.03% expense ratio. This “set it and forget it” fund captures the entire market, making it simple and low-maintenance. Beginners benefit from broad diversification, low costs, and minimal need for constant portfolio adjustments.
Are ETFs safer than individual stocks?
Yes — ETFs spread risk across dozens, hundreds, or even thousands of companies. For example, owning SPY means you instantly hold the 500 largest U.S. companies. While ETFs don’t eliminate risk (markets can still fall), they protect against catastrophic losses from a single company’s collapse — unlike owning individual stocks.
How much should I invest monthly?
A common rule of thumb is to invest 10–20% of your monthly income. Using Dollar-Cost Averaging (DCA), you can smooth market volatility by investing regularly, instead of trying to time the market. Consistency matters more than timing — start with what you can afford and increase as your income grows.
Which ETFs pay dividends?
Several ETFs focus on dividends, such as Vanguard High Dividend Yield (VYM) or Schwab U.S. Dividend Equity (SCHD). Even broad-market ETFs like SPY and VTI pay dividends quarterly. Dividend ETFs are excellent for investors seeking passive income in addition to long-term growth.
How often should I rebalance my ETF portfolio?
Most long-term investors rebalance once or twice per year. Rebalancing restores your original asset allocation (e.g., 60/40 stocks/bonds) after market movements shift your weights. Too frequent rebalancing may cause unnecessary trading costs, while too rare may expose you to more risk than intended.
Can I hold ETFs in retirement accounts?
Absolutely. ETFs can be held in tax-advantaged accounts like IRAs, 401(k)s, RRSPs, and TFSAs. Holding ETFs in retirement accounts can reduce capital gains taxes, making them even more efficient. Always check your country’s tax rules before investing.
9. Conclusion: Building Wealth with ETFs
The Top 10 ETFs for long-term investing (2015–2025) demonstrate the power of low costs, diversification, and disciplined strategies. Whether your goal is growth, stability, or income, ETFs like SPY, QQQ, VTI, and AGG can help you build lasting wealth.
Don’t just read about ETFs — test them yourself. Use our Investment Simulator to backtest strategies, and upgrade to Premium for advanced tools like multi-portfolio tracking, auto-rebalancing, and detailed export reports.
🚀 Try Premium ETF Simulator Now
Disclaimer: This content is for educational purposes only and not financial advice. Always research before investing.