Bitcoin ROI Since 2009: Was It Worth the Hype?
Bitcoin ROI since 2009 is one of the most dramatic return stories in modern finance, but the headline number only tells part of the truth. The real question is not whether Bitcoin went up. It is whether a normal investor could survive the volatility, size the position intelligently, and hold through repeated collapses without destroying their plan.
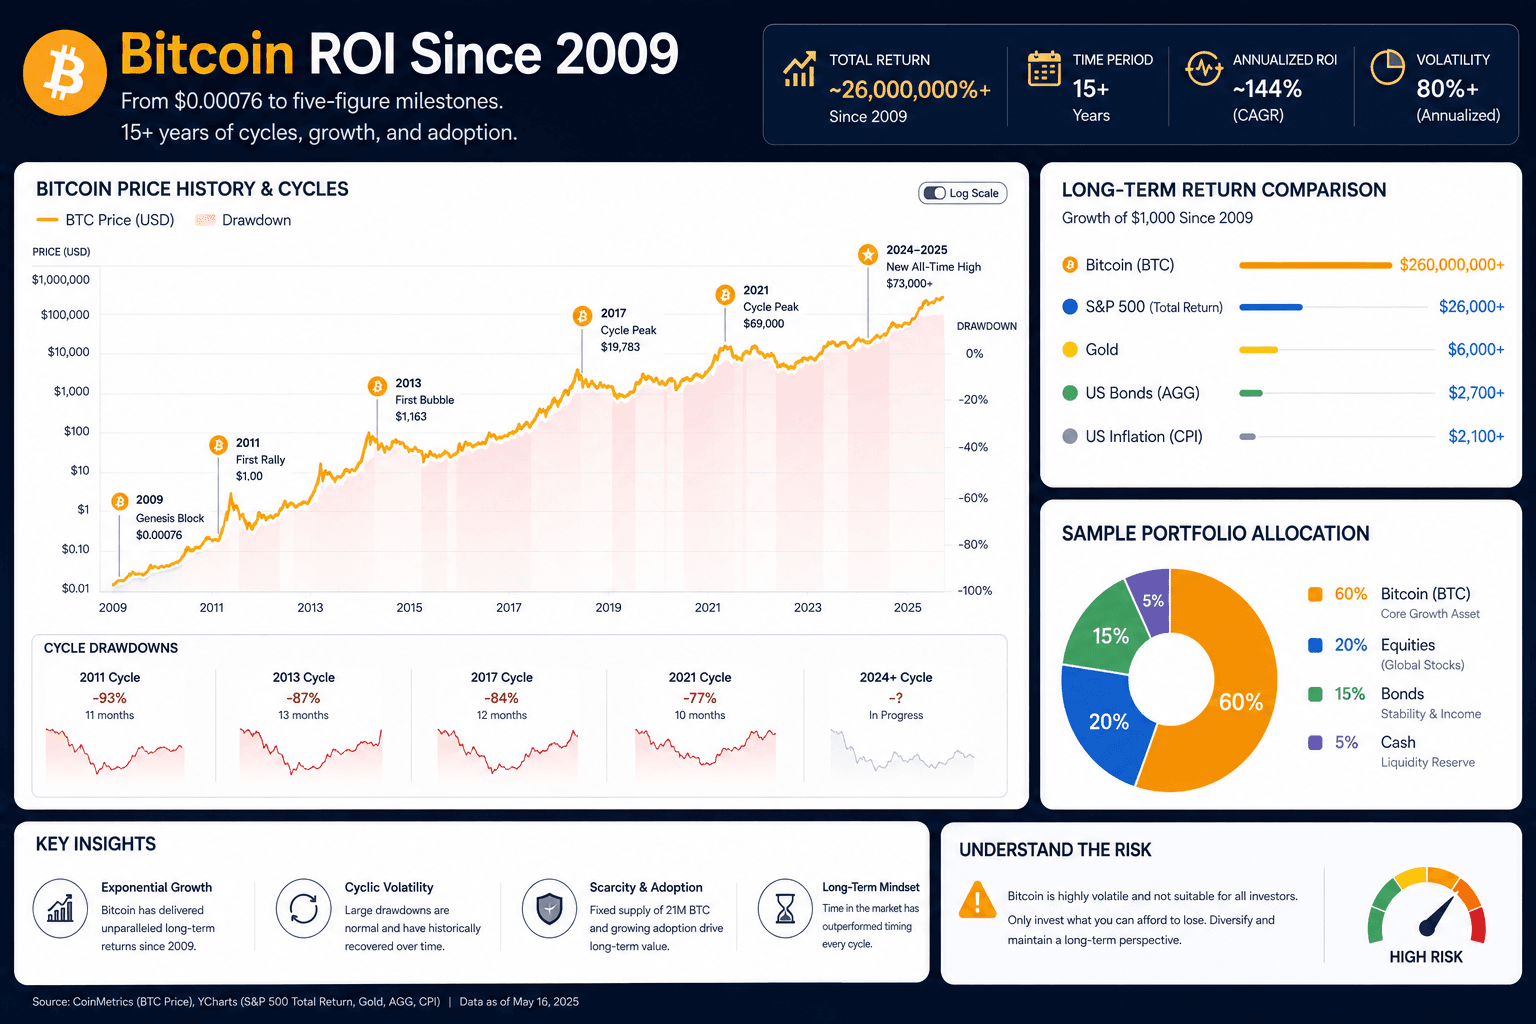
Quick Answer: Was Bitcoin ROI Since 2009 Worth the Hype?
Bitcoin ROI since 2009 was historically extraordinary, but it was not easy money. The investor who bought very early and held through every cycle saw one of the strongest asset returns of the modern era. The investor who bought near cycle tops, over-allocated, used leverage, or sold during fear often had a very different experience.
The most useful answer is balanced: Bitcoin deserved attention because its long-term price appreciation was real, but the hype often ignored the hard part. A chart that moves from tiny prices to major global recognition looks obvious in hindsight. In real time, each cycle came with exchange failures, regulatory fear, severe crashes, macro uncertainty, and long periods where critics declared the asset dead.
That is why the right question is not simply “how much did Bitcoin return?” The better question is: what allocation, purchase schedule, and holding rule would have allowed you to benefit from Bitcoin without letting it dominate your financial life? For many investors, that answer points toward small position sizing, recurring investing, and a written rebalancing rule rather than an all-in bet.
Maximum upside came from buying early and staying invested through multiple brutal cycles.
Recurring purchases helped reduce timing pressure and spread entry points across volatility.
The biggest risk was often behavior: buying euphoria, selling fear, or sizing too large.
Bitcoin usually fits better as a controlled high-volatility sleeve than a full plan.
Why Bitcoin’s Inception ROI Still Matters
Bitcoin is unusual because its return history is not only a financial chart. It is also a story about adoption, skepticism, infrastructure, regulation, liquidity, and investor psychology. When people search for Bitcoin ROI since 2009, they are usually trying to answer a deeper question: did the asset prove itself, or was it just a speculative bubble that happened to survive?
The starting point also matters because Bitcoin began as a technical monetary experiment, not as a polished investment product. The original Bitcoin whitepaper framed it as a peer-to-peer electronic cash system. That origin helps explain why early Bitcoin ROI since 2009 came with unusual uncertainty around adoption, custody, liquidity, and long-term survival.
The answer depends on what you are measuring. Bitcoin clearly produced extraordinary price appreciation from its earliest days. It also survived multiple crashes, exchange collapses, national bans, institutional skepticism, and repeated periods of very negative media coverage. That survival matters because many speculative assets go through one boom and never recover. Bitcoin went through several major cycles and kept rebuilding liquidity and attention.
At the same time, strong historical return does not automatically make Bitcoin a good future investment at any price. The early ROI came from moving from near-zero adoption to global awareness. Future returns begin from a much larger base. That does not mean future upside is impossible, but it does mean investors should avoid extrapolating early percentage returns as if the same path can repeat indefinitely.
For long-term investors, Bitcoin’s history is most useful as a stress test. It teaches that return and volatility are inseparable. It shows how an asset can be mathematically successful while emotionally difficult. It also highlights why tools like the investment simulator and DCA calculator are helpful: they let you test timing, contribution schedules, and holding periods instead of relying on a single viral return number.
The core lesson
Bitcoin’s past ROI was not a smooth reward for simply being right. It was a reward for surviving uncertainty, volatility, and long periods where the obvious emotional decision was to quit.
Bitcoin ROI by Cycle: What the History Actually Shows
Bitcoin’s return history is better understood as a sequence of cycles rather than one clean line. Each cycle had a different investor base, narrative, liquidity profile, and risk environment. Early cycles were dominated by hobbyists, technologists, and high-risk speculators. Later cycles brought exchanges, funds, public companies, institutions, and broader retail participation.
Looking at Bitcoin through cycles helps avoid two common mistakes. The first mistake is assuming the early ROI was easy to capture. It was not. The asset was obscure, difficult to buy safely, and surrounded by uncertainty. The second mistake is assuming every cycle must repeat the same percentage return. As market capitalization grows, the same percentage moves require much larger amounts of capital.
Bitcoin moved from experiment to niche digital asset. The ROI potential was enormous, but practical access, custody, and confidence were major barriers. Most people had no realistic process for buying and holding it safely.
Bitcoin entered broader public awareness. Early exchanges, media attention, and the first major retail waves created explosive upside, followed by deep collapses that tested conviction.
The market matured. Futures, institutional narratives, public-company treasury discussions, and macro liquidity brought new buyers. The upside remained strong, but the asset was no longer invisible.
Bitcoin faced a severe risk-off environment, crypto lending failures, and broad deleveraging. This period reminded investors that crypto drawdowns can be both financial and psychological.
The conversation shifted toward regulation, spot ETF access, institutional infrastructure, and Bitcoin’s role as a long-term alternative asset. The return story became more mature, but still volatile.
That cycle-based view is important for SEO readers and real investors alike. “Bitcoin ROI since 2009” sounds like one simple statistic. In practice, it is a compressed summary of several different markets. Buying in 2011 was not the same decision as buying in 2017, 2021, or after a crash. The asset may have the same ticker, but the entry price, available information, and risk context changed dramatically.
How to Calculate Bitcoin ROI Since 2009
Bitcoin ROI is usually calculated with a simple formula: final value minus initial cost, divided by initial cost. If an investor bought Bitcoin at a very low early price and held until a much higher price, the percentage gain becomes enormous. That is the headline version. It is useful, but incomplete.
A stronger methodology separates three different measurements. The first is point-to-point ROI, which compares a single start date to a single end date. The second is DCA ROI, which models recurring purchases over time. The third is investor return, which considers whether the investor actually followed the plan through crashes, taxes, fees, custody issues, and emotional pressure.
| ROI method | What it measures | Why it matters | Main weakness |
|---|---|---|---|
| Point-to-point ROI | One purchase date and one ending date | Shows the clean headline return from a chosen period | Can exaggerate how realistic the outcome was |
| DCA ROI | Recurring purchases over time | Reflects a more realistic savings and investing behavior | Usually misses the maximum upside of buying early with a lump sum |
| Portfolio ROI | Bitcoin as part of a diversified portfolio | Shows how a small allocation affects the whole plan | Requires assumptions about rebalancing and risk tolerance |
| Behavior-adjusted ROI | The return an investor actually kept | Accounts for panic selling, FOMO buying, and poor timing | Hard to measure without personal transaction history |
This distinction matters because Bitcoin’s historical return is highly sensitive to entry date. A person who bought after a major crash may have seen strong returns quickly. A person who bought near a peak may have waited years to recover. Both experiences are part of Bitcoin history, but they teach different lessons.
That is why readers should be careful with articles that only say, “If you invested X in Bitcoin in 2009, you would have Y today.” Those examples are interesting, but they are not a complete plan. A more useful analysis asks how much you could invest, how frequently you would buy, whether you would rebalance, and how much volatility you could tolerate without abandoning the position.
Why the Headline ROI Can Be Misleading
The biggest problem with Bitcoin ROI since 2009 is that the number can become so large that it stops being practical. It turns into a fantasy scoreboard. Investors look backward and imagine that the correct decision was obvious. But in the early years, Bitcoin was not a mainstream asset with clean brokerage access, regulated custody, and widespread education. It was a technical experiment with uncertain survival odds.
Hindsight also hides position sizing. An investor might say they would have put $10,000 into Bitcoin in 2010, but would they really have done that at the time? Would they have understood private keys? Would they have avoided losing the coins? Would they have held through the first 80% collapse? Would they have resisted selling after a 10x gain? The ROI chart assumes perfect behavior. Real life rarely gives that.
The headline ROI also ignores opportunity cost and portfolio context. If Bitcoin was 1% of a portfolio, even a massive gain could become meaningful without risking everything. If Bitcoin was 90% of a portfolio, the investor had to endure huge wealth swings that could affect housing, retirement, business decisions, family stress, and sleep. The same asset return can create very different life outcomes depending on allocation.
Past winners often look easy only after the uncertainty has disappeared.
Bitcoin survived, but many early crypto-like bets did not produce lasting value.
Extreme volatility makes the final chart much easier than the real experience.
Bitcoin Drawdowns: The Price of the Return
Bitcoin’s long-term ROI cannot be separated from its drawdowns. A drawdown is the decline from a previous peak to a later low. For Bitcoin, drawdowns have often been severe. Multiple cycles involved declines that would be considered catastrophic in many traditional asset classes.
This is the part many ROI summaries understate. If an investment falls 80%, it needs a 400% gain just to return to break-even. If it falls 90%, it needs a 900% gain. Bitcoin has recovered from major drawdowns before, but recovery was never guaranteed while the crash was happening. Investors had to decide whether the thesis remained intact while prices, news, and sentiment were moving against them.
Drawdowns affect behavior in several ways. They make investors question the asset. They create pressure from friends, family, and media. They can force selling if the investor used leverage or needed the money. They also make over-allocation painful. A small Bitcoin allocation can be tolerable during a crash. A huge allocation can feel like a personal crisis.
| Risk area | What happens | Practical investor response |
|---|---|---|
| Price drawdown | Large declines from cycle highs | Use position sizing and avoid investing money needed soon |
| Volatility fatigue | Repeated swings create emotional exhaustion | Use a written plan before the market becomes stressful |
| Liquidity need | Forced selling during a bad period | Keep emergency funds and short-term goals outside Bitcoin |
| Narrative risk | News cycles can shift from euphoria to panic | Separate thesis from social-media momentum |
This does not mean Bitcoin should be avoided automatically. It means historical ROI must be read together with historical pain. A return that requires unusual discipline is not the same as a return that arrives smoothly. The more volatile the asset, the more important the investing process becomes.
Bitcoin vs Stocks, Gold, and Broad Portfolios
Bitcoin’s ROI since 2009 looks enormous compared with traditional assets, but the comparison is not always apples to apples. Stocks represent ownership in businesses. Gold is a scarce physical store-of-value asset with a long history. Bonds are designed for income and stability. Bitcoin is a digital scarcity asset with network effects, monetary narrative, and high speculative sensitivity.
Compared with stocks, Bitcoin has produced much higher upside in selected periods, but with far more volatility and less conventional valuation support. A stock index has earnings, dividends, buybacks, sector weights, and decades of historical data. Bitcoin has scarcity, adoption, liquidity, macro narratives, and market structure. Investors can compare returns, but the drivers are different.
Compared with gold, Bitcoin is often described as digital gold. That comparison can be useful, but it has limits. Gold has thousands of years of cultural and monetary history. Bitcoin has portability, verifiability, fixed supply rules, and a digitally native user base. Gold has tended to be less volatile. Bitcoin has offered higher upside but far deeper crashes.
Compared with a diversified portfolio, Bitcoin behaves more like a high-volatility satellite. A small allocation can influence return without taking over the entire plan. A large allocation can dominate risk. This is why some investors prefer to test Bitcoin as 1%, 3%, 5%, or 10% of a portfolio rather than asking whether Bitcoin should be all-or-nothing.
Bitcoin ROI Since 2009: Lump Sum vs DCA
For Bitcoin, lump sum investing and dollar-cost averaging can lead to very different emotional experiences. A perfect early lump sum produced the strongest mathematical outcome. But a perfect early lump sum is also the least realistic scenario for most investors. It required conviction before Bitcoin was widely understood, operational skill to hold it safely, and the ability to resist selling during enormous gains and crashes.
DCA is usually less spectacular in hindsight, but more realistic. It allows an investor to build exposure over time. It reduces the pressure of choosing one exact entry date. It can be especially helpful in a volatile asset because purchases happen across both euphoric and fearful markets. The tradeoff is that if the asset rises sharply and never revisits lower prices, DCA may underperform an early lump sum.
The right method depends on cash availability and psychology. If you already have a large amount of cash and a high tolerance for volatility, a structured lump sum may make sense. If you earn monthly income and want exposure without turning Bitcoin into an emotional event, DCA may fit better. Many investors use a hybrid: invest a portion upfront, then DCA the rest over a defined period.
Works best when the entry price is attractive and the investor can withstand immediate drawdowns.
Spreads timing risk and matches how most people actually earn and invest money.
Combines a starting allocation with recurring buys to reduce regret on both sides.
To explore that in more detail, compare this article with What If You Invested $100 in Bitcoin Every Month Since 2015? and What If You Invested $1,000 in Bitcoin Every Month Since 2017?. Those articles focus more directly on recurring purchase behavior, while this article focuses on the broader Bitcoin ROI since 2009 story.
What Role Should Bitcoin Play in a Portfolio?
Bitcoin’s historical ROI tempts investors to think in extremes. Either it is the only asset that matters, or it is too volatile to touch. A more useful approach is to define its portfolio role. For many investors, Bitcoin is not a replacement for emergency savings, retirement diversification, or basic financial planning. It is a high-volatility satellite position that may improve upside but can also increase stress.
Position sizing is the most important decision. A 1% allocation can participate in upside while limiting damage if the thesis fails. A 5% allocation can become meaningful if Bitcoin performs well, but it will also move the portfolio more noticeably. A 20% allocation is a major bet. A 50% allocation is no longer a satellite; it becomes the main portfolio driver.
Rebalancing is also important. If Bitcoin rises sharply, its portfolio weight can grow far beyond the original plan. That can be good for returns, but it can also create hidden concentration risk. A written rebalancing rule helps investors decide in advance whether to trim gains, let winners run, or add only during predefined conditions. Without a rule, decisions often become emotional.
| Allocation size | Investor profile | Potential benefit | Main risk |
|---|---|---|---|
| 1%-3% | Crypto-curious, risk-aware investor | Small participation without dominating the portfolio | May feel too small if Bitcoin rises dramatically |
| 5%-10% | Investor with strong conviction and high volatility tolerance | Meaningful upside contribution if thesis works | Drawdowns become visible and emotionally harder |
| 20%+ | High-conviction speculative investor | Large upside exposure | Portfolio becomes highly dependent on Bitcoin cycles |
If you want to test multiple allocation sizes, the Premium DCA Calculator is designed for deeper scenario work, including weighted portfolios, benchmarks, fees, rebalancing assumptions, and saved reports. For quick checks, the free investment simulator is a good starting point.
Common Mistakes When Reading Bitcoin ROI Charts
Bitcoin ROI charts are powerful, but they can also mislead investors who do not read them carefully. The first mistake is ignoring entry point. Buying after a crash and buying after a vertical rally are not the same. The second mistake is assuming a past winner must remain a future winner. Strong historical returns can attract more capital, but they can also lead to overconfidence and crowded expectations.
The third mistake is treating Bitcoin like a guaranteed savings account. It is not. Bitcoin has periods of extreme volatility and can remain below prior highs for long stretches. Money needed for rent, taxes, emergency expenses, tuition, or near-term goals does not belong in a volatile asset just because the long-term chart looks impressive.
The fourth mistake is using leverage. Leverage can turn volatility into forced liquidation. A long-term thesis becomes irrelevant if a short-term price move wipes out the position. Many investors who were “right” about Bitcoin’s long-term direction still lost money because they used debt, derivatives, or oversized bets.
The fifth mistake is confusing conviction with plan quality. A strong belief is not a risk-management strategy. A good plan includes entry rules, position size, storage security, tax awareness, exit or rebalancing rules, and a clear understanding of what would make the thesis weaker.
Decide your allocation, contribution schedule, and rebalancing rule before price volatility tests you.
The best historical return does not help if the position size makes you sell during the next crash.
How to Think About Future Bitcoin Returns
A serious Bitcoin ROI analysis should avoid two extremes. The first extreme is assuming Bitcoin will repeat its early percentage gains forever. That view ignores how difficult it becomes for a larger asset to multiply at the same rate. Moving from a tiny network to a globally recognized asset is not the same as moving from a large market to an even larger one. The second extreme is assuming that because the early returns were so large, all future returns must be impossible. Markets do not work that neatly either.
Future Bitcoin returns will likely depend on several forces: adoption, liquidity, regulation, macro conditions, institutional access, custody infrastructure, and investor demand for scarce digital assets. None of those forces guarantees a positive outcome. They simply define the battlefield. A better investor does not pretend to know the exact future price. A better investor builds scenarios and asks what happens if the bullish, base, and bearish cases each occur.
For example, a bullish case might assume that Bitcoin continues to gain acceptance as a long-term alternative asset and benefits from broader financial access. A neutral case might assume that Bitcoin remains volatile but range-bound across long periods, producing uneven results depending on entry price. A bearish case might assume regulatory, technical, liquidity, or adoption headwinds reduce demand. The point is not to predict perfectly. The point is to know whether your plan survives more than one outcome.
This is where position sizing becomes more valuable than conviction. If you size Bitcoin as if the bullish case is guaranteed, the bearish case can damage your portfolio and behavior. If you size it too small relative to your own conviction, you may feel regret and chase later. A disciplined allocation sits between those mistakes: meaningful enough to matter if the thesis works, but small enough that a severe drawdown does not force irrational decisions.
Bitcoin gains broader acceptance, liquidity improves, and investors keep treating it as a scarce digital asset.
Bitcoin remains investable but highly cyclical, rewarding patience and punishing weak timing.
Regulation, competition, liquidity stress, or loss of demand reduces long-term return potential.
Another useful future-return question is whether Bitcoin’s volatility will decline as it matures. A lower-volatility Bitcoin might be easier for institutions and conservative investors to hold, but lower volatility could also mean lower explosive upside. A high-volatility Bitcoin may produce larger opportunities, but it also keeps the behavior challenge alive. In both cases, the investor’s process matters as much as the asset’s narrative.
Data Quality, Custody, and Practical Reality
Any article about Bitcoin ROI since 2009 should be honest about data quality. Early Bitcoin price history is less clean than modern stock or ETF data. Trading was fragmented, liquidity was thin, and exchange infrastructure was immature. Depending on the source, early prices may differ. That does not erase the overall return story, but it does mean precise early ROI numbers should be interpreted as estimates rather than perfect audit-grade measurements.
For market and network context, data providers such as Coin Metrics market data documentation and Coin Metrics network data documentation are useful reminders that crypto analysis depends on methodology, exchange coverage, timestamps, and the specific metric being measured.
Modern Bitcoin data is easier to access, but investors still need to understand what their tool is measuring. A backtest may use daily closing prices, monthly prices, or exchange-specific history. It may or may not include fees, spreads, tax impact, custody costs, or missed purchases. DCA simulations often assume that contributions happen on schedule and that the investor never stops. That assumption is useful for modeling, but it may not match real-life cash flow.
Custody is another practical difference between Bitcoin and traditional investments. With ETFs and stocks, many investors rely on brokerage custody. With direct Bitcoin ownership, the investor may need to understand wallets, private keys, recovery phrases, exchange risk, hardware wallets, and transfer mistakes. A great historical return is not useful if the asset is lost, stolen, or inaccessible. For direct ownership, operational discipline is part of the investment process.
Taxes also matter. In many jurisdictions, selling Bitcoin can create taxable gains. Rebalancing, trading, or spending Bitcoin may have tax consequences. A gross ROI chart does not show after-tax return. If an investor repeatedly buys, sells, and re-enters, the final retained wealth can differ significantly from the chart. Long-term investors should understand local tax rules or consult a qualified professional before making large decisions.
| Practical factor | Why it changes ROI | Better habit |
|---|---|---|
| Price source | Early Bitcoin data can vary by exchange and liquidity conditions | Use consistent data and treat exact early ROI as an estimate |
| Fees and spreads | Trading costs reduce final return, especially for frequent purchases | Model realistic costs when comparing DCA schedules |
| Custody | Lost keys or exchange failures can turn paper gains into zero access | Use a custody plan that matches your skill and risk tolerance |
| Taxes | Realized gains can reduce the spendable return | Track cost basis and understand local rules before selling |
This practical layer is what separates a useful Bitcoin ROI guide from a hype chart. The chart tells you what the asset did. The process tells you whether an investor could actually keep the result. For WhatIfInvested readers, that is the real value: use history as a modeling input, then build a plan around behavior, allocation, data quality, and risk controls.
Tools to Test Bitcoin ROI With Your Own Numbers
The best way to use Bitcoin history is to test your own scenario. Instead of asking what would have happened to a perfect early buyer, ask what would have happened to your actual investing behavior: your starting capital, your monthly contribution, your date range, your risk tolerance, and your preferred allocation.
Use the free tools for quick exploration. Use the Premium tool when you need more realistic portfolio modeling, benchmarks, multiple weighted portfolios, fees, rebalancing, withdrawals, saved scenarios, and exports. The goal is not to prove Bitcoin is good or bad. The goal is to understand the tradeoff before you commit capital.
Frequently Asked Questions About Bitcoin ROI Since 2009
What was Bitcoin ROI since 2009?
Bitcoin ROI since 2009 was historically extraordinary because the asset moved from near-zero early adoption to global recognition. The exact ROI depends on the start date, end date, exchange pricing, fees, and whether the investor held continuously.
Was Bitcoin worth the hype?
Bitcoin was worth studying because its long-term return, adoption, and survival through multiple cycles were significant. But the hype often ignored drawdowns, custody risk, taxes, behavior, and the difficulty of holding through crashes.
Is Bitcoin ROI since 2009 likely to repeat?
The earliest percentage returns are unlikely to repeat in the same way because Bitcoin now starts from a much larger market size. Future returns could still be positive or negative, but investors should not assume early-stage percentage gains will automatically continue.
Is DCA better than lump sum for Bitcoin?
Lump sum investing produced the best result when the entry was very early and the investor held. DCA can be more realistic for many people because it spreads timing risk and matches monthly income. The better choice depends on cash availability, risk tolerance, and behavior.
How much Bitcoin should be in a portfolio?
There is no universal allocation. Many investors treat Bitcoin as a small satellite position because it is volatile. A small allocation can participate in upside, while a large allocation can dominate portfolio risk.
What is the biggest risk in Bitcoin investing?
The biggest risk is not only price volatility. It is combining volatility with poor behavior, oversized allocation, leverage, weak custody, or money that is needed for short-term goals.
Bottom Line
Bitcoin ROI since 2009 was one of the most remarkable asset stories of the modern era, but the clean headline hides a difficult path. The investors who benefited most were not simply lucky buyers. They also had to survive uncertainty, crashes, operational risk, and the temptation to sell too early or buy too late.
The practical lesson is not to chase a perfect past. It is to build a better process. If you want Bitcoin exposure, define the role first. Decide the allocation. Choose lump sum, DCA, or a hybrid. Protect short-term cash needs. Avoid leverage. Model the outcome with real assumptions. Then judge Bitcoin as part of a full financial plan, not as a viral ROI number.