DCA in Bull Market: How Dollar-Cost Averaging Performs When Markets Rise
DCA in bull market conditions creates a different tradeoff than DCA during crashes. This guide explains when dollar-cost averaging helps, when lump sum usually wins, and how investors can use DCA during bull markets without confusing discipline with perfect timing.
When markets rise quickly and consistently.
When consistency matters more than perfect timing.
DCA reduces timing regret but may lag in strong rallies.
Monthly income naturally fits recurring contributions.
DCA in bull market: what this guide shows
DCA in bull market periods is not mainly about beating lump sum every time. It is about understanding cash flow, regret control, contribution discipline, and the cost of leaving cash uninvested while prices rise.
The visual below frames the decision clearly: monthly buys can keep an investor consistent, but delayed exposure can reduce returns in a strong rally.
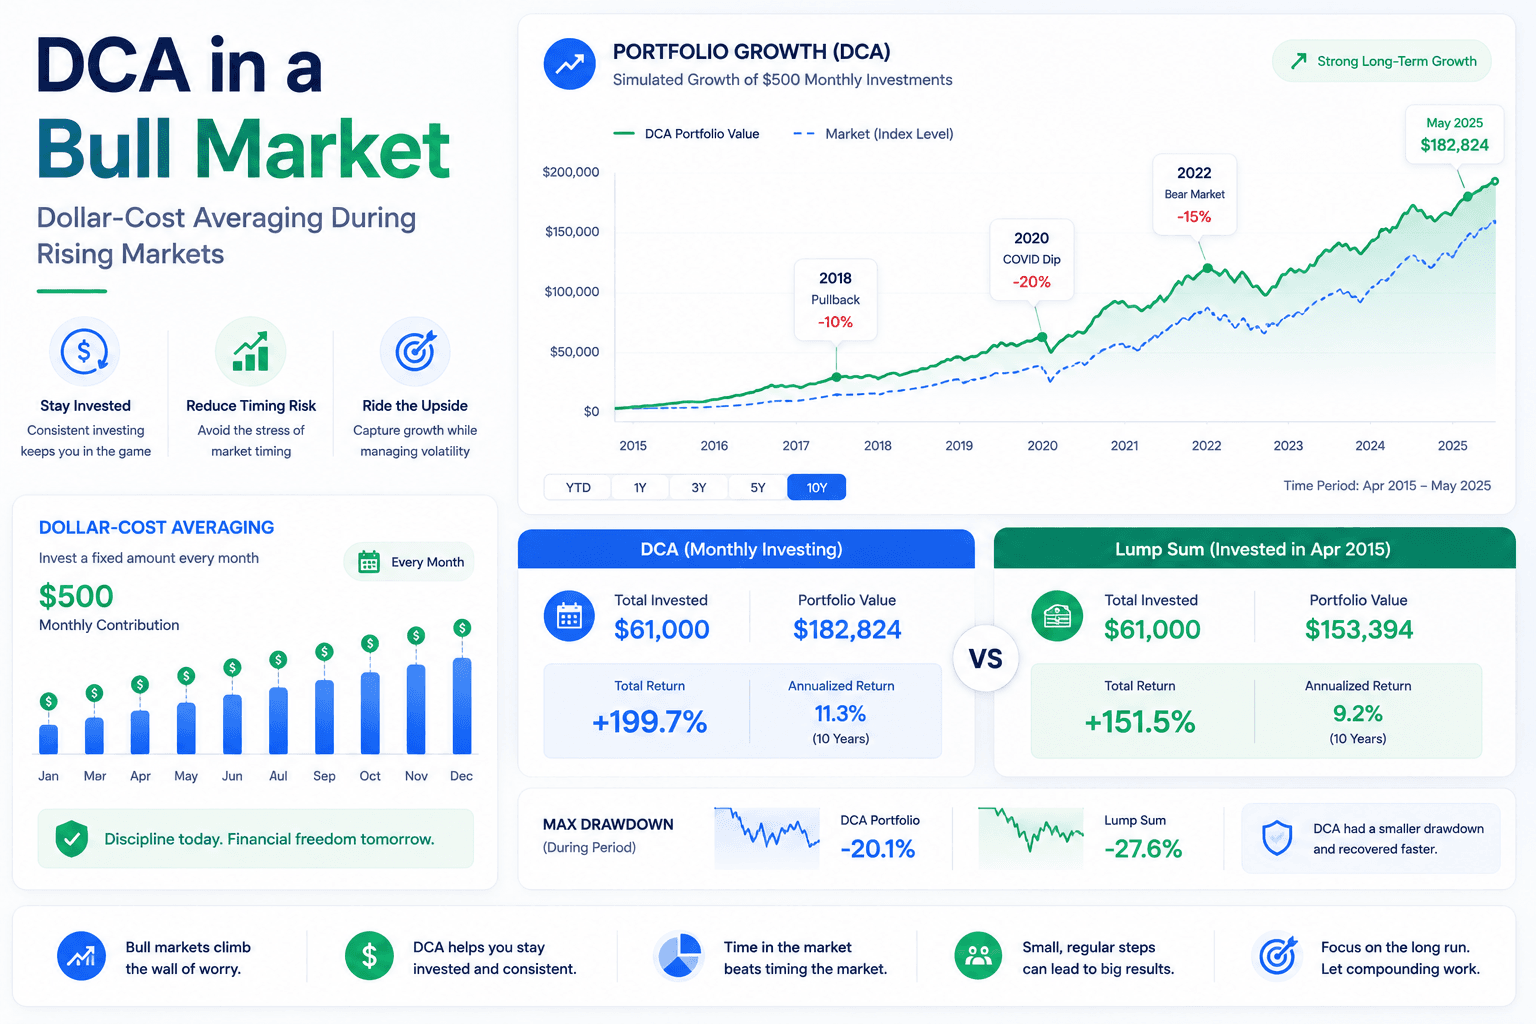
In a clean bull market, lump sum usually beats DCA. But DCA can still be the better behavior system.
When markets rise steadily, money invested earlier has more time to compound. That is why lump sum investing often beats dollar-cost averaging during strong bull markets. If an investor has $12,000 available on day one and the market climbs for the next year, investing the full amount immediately usually captures more upside than spreading that money into twelve monthly purchases.
But that does not mean DCA is useless in bull markets. DCA is not only a return-maximization strategy. It is also a behavior-management strategy. Many investors do not have a large lump sum waiting in cash. They invest from paychecks, monthly savings, bonuses, or business income. For them, DCA is not a compromise. It is the natural way capital enters the market.
The key is to understand the tradeoff. DCA in bull market conditions can reduce the stress of buying at the wrong time, make investing automatic, and help people stay consistent when markets feel expensive. The cost is that in a fast-rising market, some cash waits on the sidelines and misses early gains. A smart investor chooses DCA for the right reason: discipline, contribution rhythm, and regret control, not because it magically outperforms every market environment.
Lump sum in strong rallies
If markets move upward quickly, earlier exposure usually creates a higher ending value.
DCA for consistency
DCA turns investing into a repeatable process and reduces the pressure of picking one perfect entry point.
Depends on cash flow
If you already have cash, compare both. If you invest from income, DCA may simply be the realistic strategy.
What a bull market does to DCA math
A bull market is a period where prices generally trend upward over months or years. It does not mean every day is green. Even powerful bull markets include pullbacks, corrections, sector rotation, interest-rate scares, earnings disappointments, and emotional headlines. Still, the dominant force is upward. That matters because DCA spreads purchases over time, while lump sum invests the full amount immediately.
In a rising market, the earlier purchases tend to be the cheapest. A lump sum gets full exposure at the beginning. DCA buys some shares early, some later, and some at higher prices. That delayed exposure is the reason DCA can underperform in a strong rally. The investor may feel safer because cash is being deployed gradually, but safety has an opportunity cost when prices keep climbing.
This does not make DCA irrational. It simply means the investor should know what problem DCA is solving. If the problem is maximizing expected return when a large sum is already available, lump sum often has the advantage. If the problem is building a habit, managing regret, or investing from regular income, DCA in bull market periods may be more practical. A strategy that you actually follow can beat a mathematically superior strategy that you abandon during stress.
| Bull market feature | Effect on lump sum | Effect on DCA |
|---|---|---|
| Prices rise steadily | Full early exposure benefits quickly. | Later purchases happen at higher prices. |
| Small pullbacks occur | Already invested, but may experience short-term drawdowns. | Can buy some installments during dips. |
| Investor fear of highs | Requires confidence to invest immediately. | Feels psychologically easier. |
| Income-funded investing | Not always possible unless cash exists upfront. | Fits naturally with monthly saving. |
Why lump sum often wins during bull markets
Lump sum investing has one simple advantage: time in the market. If the expected long-term return of equities is positive, investing earlier tends to produce a higher expected outcome. In a bull market, that advantage becomes more visible because the market rewards early exposure quickly. The investor who waits may be safer for a few weeks or months, but the cash portion does not participate in the rally.
Imagine two investors with the same $12,000. Investor A invests all $12,000 immediately. Investor B invests $1,000 per month for twelve months. If the market rises 20% in a fairly smooth path during the year, Investor A participates with the entire $12,000 from the start. Investor B only has a fraction invested early and gradually increases exposure. Investor B may still earn a strong return, but likely ends with less because much of the capital joined after prices had already risen.
This is why many studies find that lump sum beats DCA more often than not when a lump sum is available. The reason is not that DCA is bad. The reason is that markets have historically gone up more often than they have gone down over long periods. Delaying investment can reduce short-term regret, but it also delays participation in the market’s positive drift, which is the main weakness of DCA in bull market rallies.
More capital exposed earlier
The full balance participates from day one, which is powerful when prices rise.
More regret if timing is poor
If the market falls soon after investing, the investor feels the full drawdown immediately.
Why DCA can still be the right move in a bull market
DCA works because it makes investing easier to continue. During bull markets, many investors hesitate because prices look expensive. They wait for a pullback that never comes, or they invest a small amount and then stop because the market feels overextended. DCA in bull market environments gives the investor a rule: invest the planned amount on schedule. That rule removes some of the emotional negotiation.
DCA is also realistic for people who do not have a lump sum. Most investors build wealth from income, not from a one-time windfall. They get paid, save a portion, and invest repeatedly. In that context, DCA is not a second-best version of lump sum. It is the actual structure of wealth building. The relevant question becomes: how much can you invest consistently, and can you increase contributions as income rises?
There is another benefit: DCA can reduce the pain of being wrong immediately. If an investor puts everything in at once and the market drops the next day, they may question the whole plan. If the investor uses DCA, a decline creates lower future purchase prices. This psychological framing can help people remain invested through volatility, even during a broader bull market.
Automatic contributions
DCA turns investing into a monthly action instead of a repeated timing debate.
Built for income
It matches how many people actually invest: paycheck by paycheck.
Less pressure
The investor does not need to choose one perfect entry point.
Three bull market scenarios that change the DCA result
The result depends on the path. A smooth rising market usually favors lump sum. A choppy bull market can make DCA look better because some installments buy dips. A late-cycle rally followed by a correction can create a mixed result where DCA reduces regret but may or may not beat lump sum depending on the ending date.
| Scenario | Market path | Likely winner | Why |
|---|---|---|---|
| Smooth rally | Prices rise steadily with shallow pullbacks. | Lump sum | Earlier exposure captures more of the move. |
| Choppy rally | Market rises but includes several 5-10% dips. | Mixed | DCA buys some dips, but may still lag if trend is strong. |
| Early drop, later recovery | Market falls after day one, then resumes upward. | DCA may win | Gradual purchases lower average entry price. |
| Late-cycle surge | Market rises fast after months of hesitation. | Lump sum | Cash waiting on the sidelines misses the strongest months. |
This is why investors should test multiple windows rather than relying on one chart. A bull market is not one single shape. It can be smooth, volatile, narrow, broad, early, late, or driven by only a handful of sectors. A good DCA analysis asks whether the strategy works across several paths, not only in a cherry-picked example. For broader investor education around recurring investing, the SEC’s Investor.gov overview of dollar-cost averaging is a useful plain-language reference.
The metrics that matter more than “who won”
Comparing ending values is useful, but it is incomplete. Investors should also compare invested capital, average cost, drawdown, contribution timing, and regret risk. A lump sum may have the highest final value but the worst short-term experience. A DCA plan may lag but keep the investor engaged and consistent.
For a complete comparison, look at the final portfolio value, total capital invested, gain, ROI, maximum drawdown, worst month, and time spent below the starting value. If you are using a tool, compare the equity curve rather than only the final number. The line tells you whether the strategy was emotionally survivable.
| Metric | Why it matters | DCA interpretation |
|---|---|---|
| Final value | Shows the outcome at the end of the window. | DCA may lag in smooth bull markets. |
| Average entry price | Shows whether contributions bought high or low. | DCA smooths the entry price over time. |
| Maximum drawdown | Shows the worst peak-to-trough loss. | DCA can reduce early drawdown if the market falls before all cash is invested. |
| Cash drag | Shows the cost of uninvested capital. | DCA has more cash drag when markets rise. |
| Behavior score | Shows whether the investor can stick with it. | DCA often wins if it prevents panic or procrastination. |
DCA is often a behavioral solution disguised as a math strategy
Many investors ask whether DCA beats lump sum because they want certainty. But the deeper issue is often fear. They are afraid of investing right before a crash, afraid of missing out, afraid of looking foolish, and afraid of making an irreversible decision. DCA breaks one big decision into smaller decisions. That can be valuable, especially when markets are hitting new highs.
During bull markets, new highs can create a strange emotional conflict. Rising prices prove that the market is strong, but they also make the investor feel late. DCA provides a compromise: participate now, but do not commit everything at once. This compromise may not maximize expected return, but it can reduce paralysis. For many people, the biggest risk is not choosing DCA over lump sum. It is doing nothing while waiting for the perfect entry.
That said, DCA should not become an excuse to hold cash forever. A twelve-month DCA plan is different from repeatedly postponing investment every time the market rises. A good DCA plan has a schedule, an end date, and a rule. Without those, it becomes market timing with nicer language.
DCA in a bull market depends heavily on what you are buying
Not every bull market is the same because not every asset rises for the same reason. Dollar-cost averaging into a broad-market ETF is different from DCA into a single stock, a sector fund, a leveraged ETF, or a speculative crypto asset. A broad ETF spreads company-specific risk across many holdings. A single stock can rise faster but can also collapse if the business disappoints. A sector ETF can work well during a theme-driven bull market, but it can become overconcentrated when enthusiasm gets extreme.
This is why a DCA in bull market plan should start with the asset, not the calendar. A monthly contribution into a diversified index fund can be a long-term habit. A monthly contribution into a hot stock after a huge rally may simply be momentum chasing. The same DCA mechanics can support disciplined wealth building or hide risky concentration. The difference is the underlying asset and the reason you are buying it.
During bull markets, investors often feel pressure to buy what has already gone up the most. That can be dangerous. If the asset is broad and still fits the long-term plan, DCA can be sensible. If the asset is only attractive because it recently doubled, the investor should slow down and define the thesis. DCA does not turn a weak investment case into a strong one. It only spreads the entry price.
| Asset type | DCA fit during bull markets | Main risk | Better use |
|---|---|---|---|
| Broad index ETF | Strong fit for long-term monthly investing. | Market-level drawdowns and valuation risk. | Core portfolio building. |
| Sector ETF | Useful if allocation is controlled. | Theme concentration and late-cycle overvaluation. | Satellite exposure with review rules. |
| Single stock | Higher risk; requires business analysis. | Company-specific disappointment. | Small position with clear thesis. |
| Crypto asset | Can reduce timing regret but remains volatile. | Deep drawdowns, custody, regulation, sentiment. | Small high-risk allocation. |
The middle path: invest part now and DCA the rest
Investors often treat the choice as all lump sum or all DCA. In practice, a hybrid plan can be more comfortable. For example, an investor with $12,000 could invest $6,000 immediately and spread the remaining $6,000 over six months. This gives the portfolio meaningful market exposure right away while still reducing the emotional risk of buying everything at a temporary high.
A hybrid plan can be especially useful during a bull market because it respects both realities. First, markets often keep rising, so waiting with all the cash can be costly. Second, bull markets still have pullbacks, so deploying some cash gradually can reduce regret if a correction happens shortly after the first purchase. The goal is not to engineer a perfect outcome. The goal is to choose a plan the investor can follow without constantly second-guessing.
The best hybrid schedule is short and specific. A three-month or six-month deployment plan may be reasonable for an investor who is nervous but does not want excessive cash drag. A twenty-four-month plan may be too slow if the money is intended for long-term investing. The longer the schedule, the more the strategy behaves like holding cash.
75% now, 25% over time
Useful when the investor believes the market trend is strong but wants modest regret control.
50% now, 50% over time
Balances immediate exposure with a structured DCA schedule over several months.
25% now, 75% over time
More comfortable for nervous investors, but creates more cash drag in a strong rally.
Accounts, taxes, and fees can change the real DCA result
A DCA backtest usually focuses on price and contribution timing, but real investors also deal with account types, currency conversion, fees, spreads, and tax reporting. These details can quietly change the final result. A monthly DCA plan with high trading fees can lose efficiency. A plan inside the wrong account can create avoidable tax drag. A plan using currency conversion every month can add costs that the investor does not notice immediately.
For Canadian investors, DCA may happen inside a TFSA, RRSP, FHSA, taxable account, or crypto platform. Each has different tax treatment and contribution rules. For U.S. investors, the choice may involve a 401(k), IRA, Roth IRA, taxable brokerage, or crypto account. The investment strategy should fit the account structure. A broad ETF inside a retirement account is often simpler than frequent taxable trades in a non-registered account.
Fees matter more when contributions are small. If an investor contributes $50 per month and pays a commission each time, the fee can consume a meaningful share of the contribution. Low-cost brokerages, fractional shares, automatic investment plans, and commission-free ETFs can make DCA more efficient. For crypto DCA, spreads and withdrawal fees should be checked carefully.
| Friction | Why it matters | Practical fix |
|---|---|---|
| Trading fees | Small monthly contributions can be hurt by fixed commissions. | Use low-cost or commission-free platforms where available. |
| Currency conversion | Monthly USD purchases from CAD can add repeated FX costs. | Compare Canadian-listed alternatives or batch conversions. |
| Tax reporting | Frequent taxable transactions increase recordkeeping. | Use tax-advantaged accounts when appropriate. |
| Expense ratios | ETF fees compound over time. | Prefer low-cost broad funds when they fit the goal. |
| Crypto spreads | Advertised zero-fee purchases may hide costs in spreads. | Compare all-in execution cost, not just commission. |
Test more than one bull market window before drawing conclusions
One of the most common mistakes in DCA analysis is choosing a single historical window and treating it as universal truth. A bull market that begins after a deep crash may reward lump sum very strongly because valuations are low and momentum improves. A late-stage bull market may be more dangerous because valuations are high and future returns are less certain. A narrow bull market led by a few technology stocks may produce a different DCA outcome than a broad bull market where many sectors participate.
To make the analysis stronger, test several windows. Compare an early bull market, a mature bull market, and a choppy bull market. Then compare the results across lump sum, monthly DCA, and a hybrid approach. If the same strategy works across different windows, confidence improves. If the winner changes depending on the start date, the investor should focus more on behavior and risk tolerance than on one perfect historical result.
This is also where WhatIfInvested tools become valuable. Instead of reading a generic statement like “lump sum beats DCA,” you can test the exact asset, dates, contribution amount, and frequency that match your own scenario. A $100 monthly investor, a $1,000 monthly investor, and a $50,000 lump-sum investor are not solving the same problem.
After a major crash
Lump sum often looks very strong because the market rebounds from depressed levels.
Uptrend with corrections
DCA may buy enough dips to narrow the gap against lump sum.
High optimism
DCA may reduce regret if a correction arrives after a long rally.
Before choosing DCA in a bull market, answer these questions
A good decision process prevents the investor from turning a strategy into a reaction. If the market is rising and you feel pressure to act, pause and answer a few concrete questions. Do you already have a lump sum? Is the money intended for long-term investing? Can you accept a drawdown after investing? Are you choosing DCA because it fits your cash flow, or because you are afraid of buying near a high?
If you are investing monthly from income, the decision is straightforward: automate the plan and keep it simple. If you already have a large cash balance, the decision needs more thought. You can invest all at once, use a short DCA schedule, or use a hybrid plan. The right answer should be written down before the next market headline arrives.
- Do I already have the cash? If not, DCA may simply match your income rhythm.
- What is my time horizon? Money needed soon should not be treated like long-term investment capital.
- What asset am I buying? Broad ETF, sector fund, single stock, and crypto all carry different risks.
- What schedule will I follow? Monthly, biweekly, or a fixed deployment plan?
- What would make me stop? If a 15% pullback would cause panic, adjust the allocation before investing.
- How will I measure success? Final value, consistency, lower regret, or staying invested?
The final question is the most important. If success means maximizing expected return and the investor can handle volatility, lump sum may be rational. If success means building an investing habit that survives emotions, DCA in bull market conditions may be rational. If success means balancing both, a hybrid plan may be the better practical answer.
What to do when the market is already at all-time highs
Many investors discover DCA during bull markets because they feel late. The index is at a record high, financial media is optimistic, friends are talking about gains, and every chart looks expensive. This is exactly when discipline matters. An all-time high does not automatically mean the market is about to crash. In long bull markets, all-time highs can be followed by more all-time highs. But buying at highs can still feel uncomfortable.
The practical answer is to separate the investment decision from the emotional headline. If the money is long-term capital and the asset fits your portfolio, the fact that the market is high is not enough reason to do nothing. If you are nervous, use a defined DCA in bull market schedule or a hybrid schedule. For example, invest part now, then invest the rest monthly over three to six months. That gives you exposure if the rally continues and a plan if a pullback appears.
What you should avoid is an undefined wait. Waiting for a “better entry” sounds reasonable, but it often becomes a moving target. If the market falls 5%, the investor waits for 10%. If it falls 10%, they fear a crash. If it rises instead, they feel even later. A written DCA plan solves this by replacing prediction with action.
Invest more upfront
A larger initial allocation can reduce cash drag while keeping monthly contributions active.
Use a short DCA schedule
Three to six months can balance participation and regret control.
Lower risk first
Use a broader asset mix or smaller position rather than forcing yourself into a plan you cannot hold.
This is also where contribution increases matter. A bull market can make early investors feel wealthy, but the real wealth-building engine is often the combination of market returns and rising contributions. If your income grows, increasing the monthly contribution can matter more than arguing about one perfect entry point. DCA works best when it is tied to a sustainable savings rate, not only to market forecasts.
A simple rule can help: review your contribution rate when your income changes, not every time the market moves. That keeps the process grounded in personal cash flow instead of market noise. Bull markets reward participation, but long-term investors are usually rewarded even more by a repeatable system that keeps adding capital through both strong and weak periods, without constantly rebuilding the plan from scratch every month or every market headline.
How to use DCA during a bull market without weakening your plan
The best DCA plan is specific. Decide the amount, frequency, asset, account, start date, and end date before emotions interfere. If you have a large lump sum, decide whether you will invest it immediately, split it over three months, six months, or twelve months. The longer the DCA in bull market schedule, the more cash drag you accept if markets rise.
For monthly investors, the playbook is simpler: automate the contribution as soon as income arrives. Waiting until the end of the month often means the money gets spent. Treat the contribution like a bill paid to your future portfolio. Increase the amount when income rises, but avoid changing the plan based on headlines.
- Choose the asset. Broad ETF, index fund, crypto sleeve, or mixed portfolio?
- Choose the frequency. Monthly is usually enough for most long-term investors.
- Choose the rule. Invest on schedule regardless of market headlines.
- Choose the review date. Review quarterly or annually, not daily.
- Choose the upgrade path. Use advanced tools when you need fees, benchmarks, rebalancing, or multiple portfolios.
If you want to compare these choices, use the DCA Calculator for simple recurring contribution modeling, the Investment Simulator for historical scenarios, and the Premium DCA Calculator when you need weighted portfolios, benchmarks, fees, rebalancing, saved scenarios, and exports.
Want to test DCA vs lump sum during a real bull market?
Run your own dates, contribution amount, and asset mix. The right answer changes when you include cash flow, taxes, drawdowns, fees, and your ability to stay invested.
DCA Calculator
Model recurring monthly contributions and future portfolio value.
Simulator
Backtest historical windows and compare investment paths.
Premium DCA
Add weighted portfolios, benchmarks, fees, rebalancing, exports, and saved reports.
Common mistakes investors make with DCA in bull markets
Using DCA as a way to avoid deciding
DCA should be a schedule, not a vague intention. If the plan keeps getting extended because prices rise, the investor is not dollar-cost averaging anymore. They are staying in cash while calling it discipline.
Stopping contributions because the market feels expensive
Bull markets can stay expensive for a long time. If the investor stops every time valuations look high, the DCA in bull market plan loses its main benefit: consistency.
Comparing a monthly investor to someone with a lump sum
If you only have monthly cash flow, lump sum may not be available. The right comparison is not theoretical perfection. It is the best use of the money you actually have.
Ignoring asset allocation
DCA into a concentrated or speculative asset can still be risky. A recurring investment plan does not replace diversification, risk control, or portfolio review.
Forgetting fees and taxes
Frequent purchases can create transaction costs on some platforms. Selling later can create taxable events. Use low-cost tools and tax-aware accounts when possible.
Frequently asked questions
Does DCA perform well during bull markets?
DCA can perform well, but it often trails lump sum when markets rise steadily because some capital is invested later at higher prices.
Is lump sum better than DCA in a bull market?
Often yes, if a large amount of cash is available at the start and the market rises. Lump sum benefits from earlier exposure.
Why use DCA if lump sum has higher expected returns?
DCA can reduce timing regret, support automatic investing, and help investors stay consistent when markets feel expensive or uncertain.
What frequency is best for DCA?
Monthly investing is usually practical for long-term investors because it matches paychecks and keeps the system simple.
Can I combine lump sum and DCA?
Yes. Some investors invest part immediately and spread the rest over several months to balance market exposure and emotional comfort.
How can I test DCA during past bull markets?
Use the WhatIfInvested Simulator or DCA Calculator to compare date ranges, contribution amounts, assets, and lump-sum alternatives.
What is the biggest risk of DCA in bull market conditions?
The biggest risk is cash drag. If the market rises strongly while part of your money waits on the sidelines, the delayed purchases may reduce the final value compared with investing earlier.
When is DCA in a bull market still the right choice?
DCA can still be the right choice when you invest from monthly income, want a repeatable habit, or need a defined schedule to reduce hesitation around market highs.
Educational simulation only. Historical performance does not guarantee future results. This article is educational, not financial advice. Results vary by date range, asset, fees, taxes, contribution schedule, cash drag, and investor behavior.