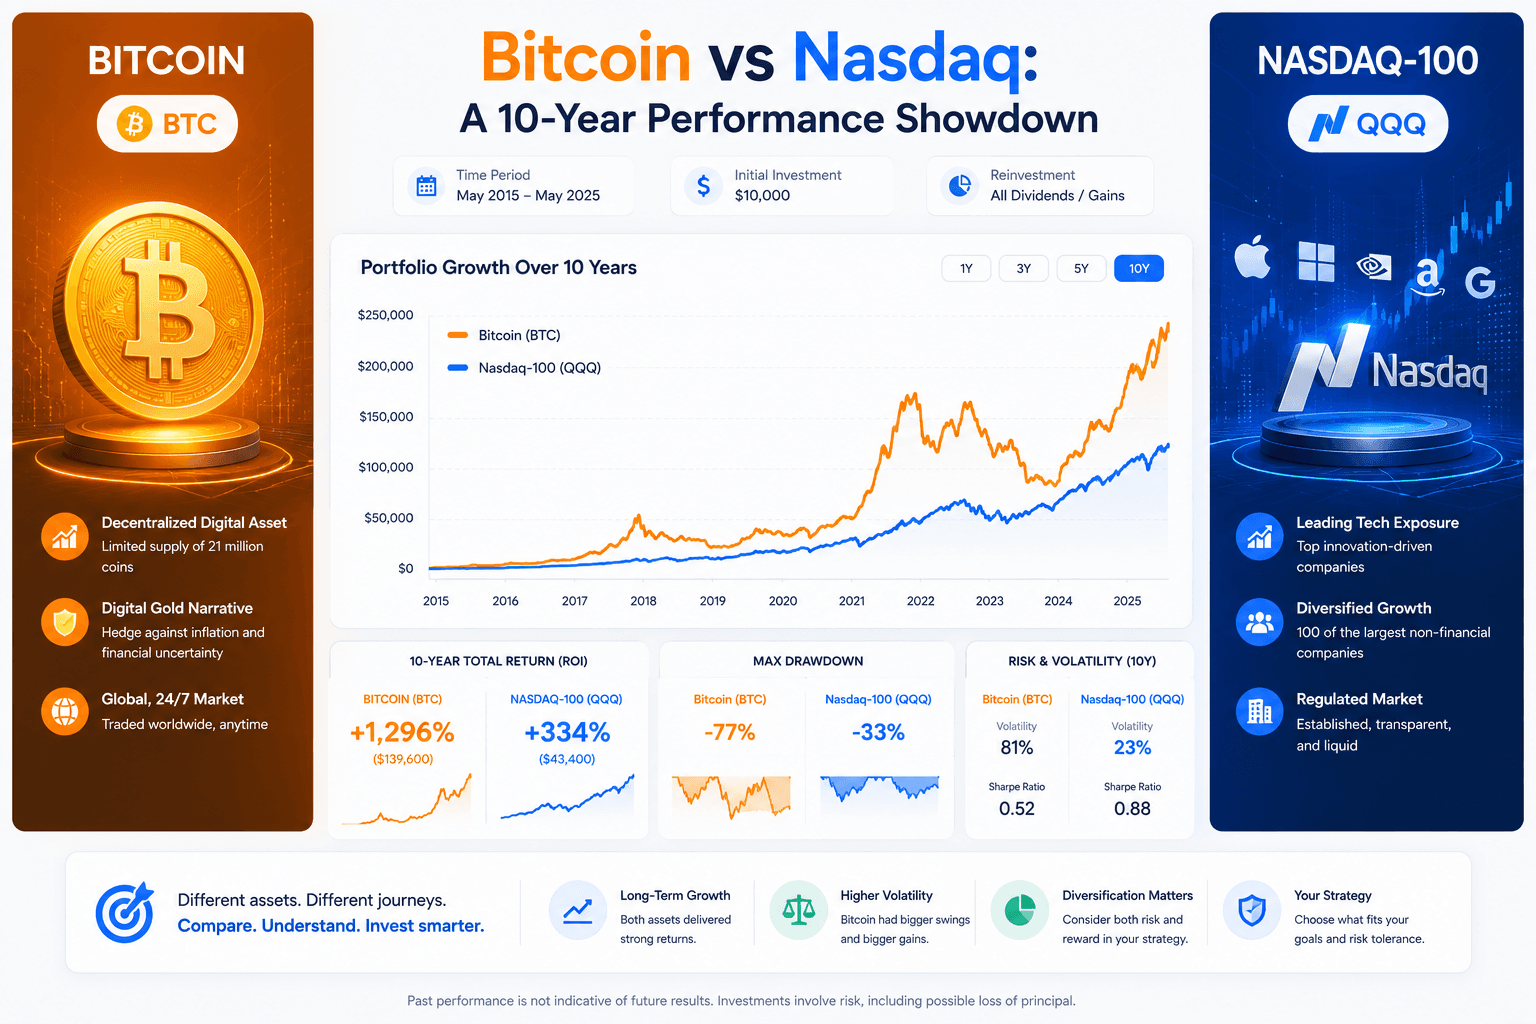
Bitcoin vs Nasdaq: A 10-Year Performance Showdown
Bitcoin vs Nasdaq is a powerful comparison because the two assets tell very different growth stories. One is a scarce crypto asset with extreme boom-and-bust cycles. The other is a technology-heavy equity benchmark powered by public companies, earnings, innovation, and investor expectations. This guide compares return, drawdown, risk, allocation use cases, and what investors should actually learn from the contrast.
$1,000 in BTC from 2014 to May 2026, before fees and taxes.
Nasdaq-100 ETF proxy over the same broad period.
Extreme historical peak-to-trough stress in the dataset.
Still painful, but much less severe than Bitcoin.
Bitcoin won on raw return. Nasdaq won on stability.
The simplest reading of the Bitcoin vs Nasdaq comparison is this: Bitcoin created far more wealth for investors who bought early and survived its volatility, while Nasdaq exposure provided a more stable growth path tied to technology companies, earnings, public markets, and a familiar ETF ecosystem. If you judge only by total return, Bitcoin dominated. If you judge by survivability, drawdown control, and psychological difficulty, Nasdaq was much easier to hold.
That distinction matters because investors do not experience returns in a spreadsheet. They experience fear, regret, news cycles, account losses, and the temptation to sell at the worst time. A Bitcoin investor who saw a 10x move had to accept the possibility of losing 70% to 80% or more during major drawdowns. A Nasdaq investor faced crashes too, but the path was usually less violent and easier to explain as part of equity-market risk.
Massive asymmetric upside, but only for investors who held through severe crashes.
Lower volatility, easier rebalancing, and a more familiar investment framework.
The winner changes when you include risk tolerance, time horizon, and position size.
For most investors, this is not a question of choosing one winner forever. It is a question of role. Bitcoin may fit as a high-volatility satellite position. Nasdaq exposure may fit as a growth-equity core or growth sleeve. The right mix depends on your drawdown tolerance, investing horizon, tax situation, belief in crypto adoption, and ability to rebalance without panic. That is why the Bitcoin vs Nasdaq decision should be framed as portfolio design, not just a winner-take-all contest.
What this comparison actually measures
Bitcoin is a digital asset with a fixed supply schedule, global trading, and no traditional cash flows. Its price is driven by adoption, liquidity, market sentiment, risk appetite, regulatory expectations, and the belief that scarce digital property has long-term value. Bitcoin does not have earnings, revenue, dividends, or an expense ratio. That makes it very different from an equity index.
The Nasdaq comparison is often used as shorthand for technology-heavy equity exposure. In practice, many investors access Nasdaq-style exposure through funds such as QQQ, which tracks the Nasdaq-100 rather than the full Nasdaq Composite. QQQ is not exactly the Nasdaq Composite, but it is a practical investable proxy for technology-heavy U.S. growth exposure. It includes large public companies with business models, financial statements, and index rules.
For an official definition, Nasdaq describes the Nasdaq-100 Index as a large-cap benchmark made up of 100 non-financial companies listed on Nasdaq. That matters because a clean Bitcoin vs Nasdaq comparison should clearly separate Bitcoin, the Nasdaq Composite, the Nasdaq-100, and ETF proxies such as QQQ.
Scarce digital asset
Return depends on adoption, liquidity, sentiment, supply scarcity, regulation, and willingness of investors to hold through extreme volatility.
Technology-heavy equity exposure
Return depends on public company earnings, interest rates, innovation cycles, valuations, and sector leadership.
Because these assets are structurally different, the comparison should not be treated as a simple horse race. Bitcoin can rise much faster because it is smaller, more volatile, and more reflexive. Nasdaq exposure is tied to companies that can grow earnings over time, but it is also affected by valuations and interest rates. A useful Bitcoin vs Nasdaq article compares not only who went up more, but what kind of risk the investor had to accept.
The return gap was enormous, but the risk gap was enormous too
Using WhatIfInvested market-history data, a rough historical estimate from January 2014 through May 2026 shows Bitcoin growing by about 102x, while QQQ grew by about 8.2x over the same broad period. A $1,000 Bitcoin investment would have become roughly $102,000 before fees and taxes. A $1,000 QQQ investment would have become roughly $8,200 before fees and taxes.
That sounds like a clean win for Bitcoin, but the path was anything but clean. Bitcoin’s historical drawdowns were far more severe. A large loss on paper is not just a number. It challenges conviction. It raises doubts about whether the thesis is broken. It can last long enough to make investors quit. Nasdaq investors also faced bear markets, especially during rate shocks and tech valuation resets, but the emotional burden was generally lower.
| Metric | Bitcoin estimate | Nasdaq/QQQ estimate | Interpretation |
|---|---|---|---|
| Approximate period | Jan 2014-May 2026 | Jan 2014-May 2026 | Same broad window for comparison. |
| Starting investment | $1,000 | $1,000 | Simple lump-sum baseline. |
| Approximate ending value | $102,000 | $8,200 | Bitcoin delivered dramatically higher nominal growth. |
| Approximate CAGR | 45% | 18% | Bitcoin compounded faster but with far larger uncertainty. |
| Largest drawdown observed | About -98% | About -36% | Bitcoin required much more psychological endurance. |
The exact result changes depending on dates, data source, fund choice, fees, taxes, rebalancing, dividends, and whether the Nasdaq proxy is QQQ, the Nasdaq Composite, or a broader technology ETF. That is why this Bitcoin vs Nasdaq page should be read as a decision framework, not a promise that the next decade will look like the last one.
Drawdowns are where Bitcoin and Nasdaq feel completely different
Raw return charts make Bitcoin look obvious in hindsight. Drawdown charts make the decision harder. Bitcoin has experienced repeated collapses that would be unacceptable for many investors. A person who buys near a euphoric high may wait years before recovering. That waiting period is where many investors abandon the strategy.
Nasdaq exposure can also fall hard. Technology stocks are sensitive to interest rates, earnings expectations, valuation compression, and investor risk appetite. A 30% decline in a tech-heavy portfolio is not unusual during a major reset. But compared with Bitcoin, those drawdowns have usually been milder and easier to contextualize within public equity history.
Extreme loss windows
Bitcoin can deliver life-changing upside, but it can also lose most of its value from peak to trough.
Equity bear markets
Nasdaq drawdowns can be painful, especially after valuation bubbles, but they usually fit a more familiar equity-risk pattern.
Position size matters
A small Bitcoin allocation may be tolerable. A large one can dominate both returns and emotional stress.
The most dangerous mistake is building a portfolio around best-case outcomes while ignoring worst-case behavior. If an investor can tolerate a 20% drawdown but owns an asset that can fall 70%, the mismatch will show up during the next crash. The portfolio should be sized for the bad years, not the marketing chart. Bitcoin vs Nasdaq is most useful when it forces that drawdown conversation before money is committed.
Higher return does not automatically mean better portfolio fit
Bitcoin’s return was extraordinary, but risk-adjusted analysis asks a different question: how much volatility did the investor accept to earn that return? That question is not academic. Most people cannot hold unlimited volatility. They have bills, emotions, goals, and finite patience. An investment that is mathematically impressive can still be wrong for an investor who cannot survive the path.
Nasdaq-style exposure often scores better for investors who want growth with a more conventional risk profile. It still has volatility, but it is tied to productive businesses, earnings reports, and index methodology. Bitcoin is more reflexive. When confidence rises, upside can be explosive. When confidence disappears, liquidity can leave quickly.
| Question | Bitcoin answer | Nasdaq answer |
|---|---|---|
| Where does return come from? | Adoption, scarcity narrative, liquidity, and risk appetite. | Company earnings, innovation, valuation, and equity market growth. |
| What can break investor behavior? | Huge drawdowns, regulatory fear, exchange risk, long crypto winters. | Bear markets, valuation resets, concentration in mega-cap tech. |
| How easy is it to explain? | Harder for conservative investors; no cash flows. | Easier; public companies, funds, and familiar reporting. |
| Best portfolio role | High-upside satellite position. | Growth core or growth sleeve. |
A portfolio can include both. The key is not to let the most volatile asset quietly become the entire portfolio decision. If Bitcoin grows rapidly, it can become a much larger share of the account. If it crashes, it can pull down total results. Rebalancing rules help turn conviction into a system instead of a mood. A strong Bitcoin vs Nasdaq plan defines that rule before either asset moves sharply.
How DCA changes the Bitcoin vs Nasdaq comparison
A lump-sum comparison rewards whoever had the best starting date and strongest ending date. Dollar-cost averaging asks a more practical question: what if an investor bought gradually over time? DCA can be especially useful with volatile assets because it reduces the risk of investing everything at a temporary peak. It does not eliminate losses, but it can make the entry path more manageable.
For Bitcoin, DCA can reduce regret and help investors avoid emotional all-in decisions. The investor buys more Bitcoin when prices are lower and less when prices are higher. That does not guarantee a profit, but it can make the strategy easier to follow. For Nasdaq exposure, DCA works well for paycheck investors who are investing monthly from income rather than deploying a large cash balance.
Useful for volatility control
DCA can make a high-volatility asset more psychologically manageable, especially when price swings are extreme.
Useful for habit building
Monthly contributions into a Nasdaq-style fund can turn income into long-term growth exposure.
However, DCA is not magic. If an asset declines for years, DCA still loses money. If an asset rises sharply, lump sum may beat DCA because more money was invested earlier. The right approach depends on whether the investor has a lump sum available, how they handle regret, and whether they can maintain contributions through weak markets. In a Bitcoin vs Nasdaq DCA test, the emotional path can matter as much as the ending value.
When Bitcoin fits, when Nasdaq fits, and when both fit
Bitcoin and Nasdaq exposure can serve different jobs. Nasdaq can be a core growth engine for investors who believe in technology, innovation, and long-term earnings growth. Bitcoin can be a speculative or alternative asset allocation for investors who believe in digital scarcity and can tolerate sharp volatility.
The most balanced framing is not “Bitcoin or Nasdaq forever.” It is “what job should each asset do?” A young investor with high risk tolerance may allocate a small percentage to Bitcoin and a larger percentage to diversified equities. A conservative investor may avoid Bitcoin entirely or keep it very small. A crypto believer may hold more Bitcoin, but should understand that the portfolio will behave very differently.
| Investor type | Possible role for Bitcoin | Possible role for Nasdaq |
|---|---|---|
| Beginner investor | Small educational allocation or none. | Core growth exposure through a low-cost ETF. |
| High-risk investor | Satellite allocation with clear rebalancing rules. | Growth anchor to reduce reliance on one asset. |
| Retirement-focused investor | Usually small due to volatility. | Possible equity sleeve, balanced with broader diversification. |
| Crypto believer | Larger allocation only if drawdowns are acceptable. | Useful diversifier away from pure crypto risk. |
Premium scenario tools are helpful here because allocation questions are rarely one-dimensional. Investors may want to compare 0%, 5%, 10%, or 20% Bitcoin allocations against a Nasdaq-heavy portfolio, then add fees, rebalancing, DCA contributions, and drawdown analysis. That is a more useful Bitcoin vs Nasdaq workflow than staring at one return chart.
The real comparison is cycle behavior, not only ending value
Bitcoin and Nasdaq-style exposure move through cycles differently. Bitcoin cycles have often been shaped by halving narratives, liquidity waves, exchange infrastructure, institutional adoption, regulatory fear, and speculative momentum. Nasdaq cycles are shaped by earnings growth, interest-rate expectations, software and semiconductor demand, platform dominance, artificial intelligence enthusiasm, and valuation resets.
This matters because investors do not simply buy a chart and wake up at the ending value. They live through the middle. A Bitcoin investor may see a vertical rally and then a brutal crypto winter. A Nasdaq investor may see a multi-year tech boom and then a valuation reset when rates rise. Both assets can create wealth, but their stress patterns are different.
| Cycle type | Bitcoin behavior | Nasdaq behavior | Investor lesson |
|---|---|---|---|
| Liquidity expansion | Can rise violently when risk appetite returns. | Often benefits from growth-stock multiple expansion. | Both can rally together when money is easy. |
| Rate shock | Can fall as speculative appetite disappears. | Can fall as future earnings are discounted at higher rates. | Neither asset is immune to macro pressure. |
| Regulatory stress | Highly sensitive to exchange, custody, and policy news. | Less directly affected, though tech regulation can matter. | Crypto carries a distinct regulatory risk layer. |
| Innovation boom | Can benefit from adoption narratives and scarcity demand. | Can benefit from AI, cloud, semiconductors, and platform growth. | Both assets are connected to innovation, but through different mechanisms. |
A useful investor does not ask only which line ended higher. A useful investor asks: what caused the return, how fragile was the path, how much pain was required, and would I have stayed invested when the asset looked broken? That is the difference between hindsight performance and portfolio design. Bitcoin vs Nasdaq only becomes actionable when those questions are included.
Rebalancing can turn a volatile winner into a managed portfolio sleeve
One of the most practical ways to use Bitcoin and Nasdaq together is rebalancing. Imagine an investor starts with a small Bitcoin allocation and a larger Nasdaq or broad equity allocation. If Bitcoin surges, the investor can trim it back to the target weight. If Bitcoin crashes but the thesis remains intact, the investor can rebalance back toward the target. This process is not about predicting the top or bottom. It is about preventing one asset from silently taking over the portfolio.
Without rebalancing, Bitcoin can become dominant after a strong bull market. That may look brilliant during the rally, but it also means the portfolio is now exposed to a much larger crypto drawdown. With rebalancing, the investor converts part of extreme upside into discipline. The tradeoff is that rebalancing may reduce returns if Bitcoin keeps rising, but it may also reduce regret and risk if a crash follows. That tradeoff is central to a serious Bitcoin vs Nasdaq allocation.
Maximum upside, maximum drift
The portfolio can become increasingly dependent on Bitcoin after a major crypto rally.
Simple control system
A once-a-year review can reset weights without constant trading or daily decision fatigue.
More responsive
The investor rebalances only when an asset drifts meaningfully from its target allocation.
Rebalancing also interacts with taxes. In taxable accounts, selling Bitcoin or ETF shares can trigger capital gains. In tax-advantaged accounts, rebalancing may be simpler, but crypto access can be more limited depending on the account and country. A clean strategy should define the rebalancing rule before the market moves, not after emotions are already involved.
Taxes, custody, and implementation can change the winner
A gross performance comparison is not the same as a real investor outcome. Bitcoin can involve exchange fees, spreads, wallet security, custody decisions, tax records, and the operational risk of moving assets. Nasdaq exposure through an ETF is usually simpler: buy through a brokerage account, pay the fund expense ratio, receive tax documents, and track distributions or capital gains according to local rules.
That simplicity has value. An investment that is easier to hold and report may produce better real-life results for some investors, even if it did not have the highest historical return. Bitcoin’s operational complexity can be worth it for investors with strong conviction and good security habits. But for a total novice, the custody layer is not a small detail. A Bitcoin vs Nasdaq comparison that ignores implementation friction is incomplete.
| Issue | Bitcoin | Nasdaq ETF |
|---|---|---|
| Custody | Exchange account, self-custody, hardware wallet, seed phrase risk. | Held inside a brokerage account or retirement account. |
| Tax records | Every sale, swap, or taxable event may require careful tracking. | Usually simpler broker reporting, though distributions and sales still matter. |
| Fees | Exchange fees, spreads, withdrawal fees, and network fees. | Expense ratio, spreads, and possible trading commissions. |
| Behavioral risk | Extreme volatility can trigger panic selling or overconfidence. | Volatility is still real, but usually less extreme than crypto. |
For Canadian investors, the comparison can become even more nuanced. Nasdaq exposure may be held through Canadian-listed ETFs, U.S.-listed ETFs, RRSPs, TFSAs, or taxable accounts. Bitcoin may be held directly, through crypto platforms, or through available fund products. Currency conversion, withholding tax, and account rules can all matter. For U.S. investors, retirement account access, taxable brokerage treatment, and crypto reporting rules become central.
A practical way to decide between Bitcoin, Nasdaq, or both
The right allocation starts with the investor, not the asset. Before choosing between Bitcoin and Nasdaq exposure, define the goal. Is this money for retirement decades away? A house down payment? A speculative account? A long-term growth portfolio? A short-term reserve? Bitcoin and Nasdaq can both be wrong if the time horizon is too short.
Next, define the maximum tolerable drawdown. If seeing a 50% loss would cause you to sell, Bitcoin should be small or absent. If a 30% equity drawdown would also cause panic, even Nasdaq-heavy exposure may be too aggressive. A portfolio that only works when markets go up is not a plan. It is a hope.
- Define the goal. Long-term growth, speculation, diversification, or education?
- Define the loss limit. What drawdown could you survive without abandoning the plan?
- Choose the role. Core holding, growth sleeve, or small satellite allocation?
- Choose the implementation. Lump sum, DCA, rebalancing, or phased entry?
- Review annually. Update weights, thesis, taxes, and risk tolerance.
For many investors, the most reasonable answer is not all Bitcoin or all Nasdaq. It may be a diversified portfolio with a growth-equity core and a small crypto allocation. Others may choose no crypto at all because the volatility and custody requirements do not fit their life. Both decisions can be rational when they match the investor’s goals and temperament. That is the practical outcome of a balanced Bitcoin vs Nasdaq review.
Four allocation scenarios investors can actually compare
A more useful Bitcoin vs Nasdaq analysis does not stop at 100% Bitcoin versus 100% Nasdaq. Most real portfolios are blended. The practical question is how a small Bitcoin sleeve changes a growth portfolio that already owns Nasdaq-style exposure. A 5% Bitcoin allocation may change upside potential without completely controlling the portfolio. A 20% allocation can become a major driver of both return and stress. A 50% allocation is no longer a small satellite; it becomes a crypto-dominant strategy.
Scenario testing also helps remove emotional language from the decision. Instead of saying “Bitcoin is too risky” or “Nasdaq is too slow,” the investor can compare specific mixes. What happens with 100% QQQ? What happens with 95% QQQ and 5% Bitcoin? Does a 10% Bitcoin sleeve improve final value enough to justify deeper drawdowns? Does rebalancing reduce the worst-case path? These are better questions because they connect the asset debate to an investable plan.
| Scenario | Portfolio idea | What it tests | Best fit |
|---|---|---|---|
| 100% Nasdaq/QQQ | Pure technology-heavy equity growth. | Whether the investor needs crypto at all. | Investors who want growth but prefer traditional brokerage simplicity. |
| 95% Nasdaq / 5% Bitcoin | Small crypto satellite added to a growth sleeve. | Whether modest Bitcoin exposure adds upside without dominating behavior. | Curious investors who want exposure but low regret if Bitcoin crashes. |
| 90% Nasdaq / 10% Bitcoin | Meaningful but still limited crypto allocation. | Whether the extra volatility is acceptable for a stronger upside profile. | Higher-risk investors with a long time horizon and clear rebalancing rules. |
| 80% Nasdaq / 20% Bitcoin | Aggressive growth portfolio with substantial crypto risk. | How much Bitcoin begins to dominate drawdowns and total return. | Investors with strong conviction who can tolerate very large account swings. |
The most important output from this exercise is not only the ending value. It is the relationship between ending value and pain required. If a 10% Bitcoin allocation improves results but makes the worst drawdown emotionally impossible, it is not a better portfolio for that investor. If a 5% allocation captures some upside while keeping the plan manageable, that may be a better behavioral fit even if it does not maximize theoretical return. Bitcoin vs Nasdaq is ultimately a test of both numbers and behavior.
Bitcoin, Nasdaq, or both: the winner depends on the job
Bitcoin tends to look best when the investor is measuring maximum upside, accepts extreme volatility, and believes adoption will continue expanding over a very long time horizon. It also looks strongest when the starting point comes before a major bull cycle. In that environment, even a small allocation can materially affect the final portfolio. But this advantage depends on discipline. The investor must be able to hold through drawdowns, negative headlines, regulatory fear, and long periods where Bitcoin feels abandoned.
Nasdaq-style exposure tends to look best when the investor wants growth with a more understandable engine. Companies can report revenue, profits, margins, free cash flow, and competitive advantages. The index can still become expensive, and technology concentration can hurt during rate shocks, but the investment case is easier to connect to business fundamentals. For many investors, that familiarity increases the chance that they will stay invested during downturns.
You want asymmetric upside
It may fit when the goal is high-risk growth, the position size is controlled, and the investor can handle deep crypto winters.
You need a clearer core
It may fit when the investor wants growth exposure tied to public companies, earnings, and traditional account structures.
You separate core and satellite
Nasdaq can serve as the growth base while Bitcoin is sized as a volatile satellite with explicit rebalancing rules.
The worst answer is copying someone else’s allocation without copying their income, account size, time horizon, tax situation, risk tolerance, and behavior. A young investor with stable income and decades ahead may rationally accept more volatility than someone who needs the money soon. A person who already owns a concentrated technology stock portfolio may not need even more Nasdaq-style exposure. A person who already has crypto exposure through work, business, or private holdings may need less Bitcoin in the portfolio, not more. This is why every Bitcoin vs Nasdaq answer should be personalized.
How to test your own Bitcoin vs Nasdaq decision on WhatIfInvested
The cleanest workflow is to test the simple case first, then add realism. Start with a free historical simulation using one Bitcoin proxy and one Nasdaq-style proxy. Choose a date range that matches the period you actually care about. A 10-year window, a bull-market window, and a crash-recovery window can tell different stories. Then compare lump sum and monthly DCA if the decision involves recurring contributions from income.
After the simple test, move to advanced assumptions if the decision is meaningful. Add portfolio weights, fees, benchmarks, rebalancing, and saved scenarios. This is where the comparison becomes more realistic. A portfolio that looks amazing before fees, taxes, and rebalancing may look different after friction. A strategy that wins on final value may lose on drawdown comfort. The goal is not to find the most dramatic chart. The goal is to find a strategy you can actually follow.
- Run a baseline. Compare Bitcoin and QQQ over the same date range with a simple lump-sum input.
- Add contributions. Test monthly DCA to see how regular investing changes the entry path.
- Test allocation weights. Compare 0%, 5%, 10%, and 20% Bitcoin sleeves against a Nasdaq-heavy portfolio.
- Add realism. Include fees, rebalancing rules, and possible withdrawals if the portfolio is not purely accumulation focused.
- Save scenarios. Keep the best candidates so you can compare them later instead of rebuilding assumptions every time.
This process also supports better SEO intent for readers because it answers the question behind the keyword. People searching for Bitcoin vs Nasdaq do not only want a winner. They want to know what the winner means for their own money. A tested scenario is more valuable than a generic opinion because it turns an interesting Bitcoin vs Nasdaq comparison into a decision tool.
Want to compare Bitcoin, Nasdaq, DCA, and rebalancing with your own assumptions?
Historical results change with dates, contribution amount, allocation, fees, rebalancing rules, and whether you invest all at once or monthly. Test the assumptions before turning a Bitcoin vs Nasdaq headline chart into a portfolio decision.
Free Simulator
Run quick historical tests for major assets and compare investment paths.
Premium DCA
Compare weighted portfolios, benchmarks, fees, rebalancing, and saved scenarios.
Premium workflow
Unlock deeper analysis when you need investor-ready scenarios, reports, and exports.
Common mistakes when comparing Bitcoin and Nasdaq
Choosing only the asset with the highest past return
Past return is useful, but it is not a complete investment plan. The highest-returning asset in one decade may not be the highest-returning asset in the next. Investors should ask whether the future drivers still exist, whether the valuation is reasonable, and whether they can survive the worst years. That is especially true in a Bitcoin vs Nasdaq debate because the return gap can hide the risk gap.
Ignoring position size
A 5% Bitcoin allocation behaves very differently from a 70% Bitcoin allocation. The same asset can be reasonable or reckless depending on size. Position size is the bridge between conviction and risk management.
Comparing Bitcoin with the wrong Nasdaq proxy
Nasdaq Composite, Nasdaq-100, QQQ, and technology-sector ETFs are related but not identical. If you use QQQ, say QQQ. If you use the Nasdaq Composite, say Nasdaq Composite. Clean comparisons need clean definitions.
Forgetting tax and custody issues
Bitcoin introduces custody, exchange, wallet, and tax-record complexity. Nasdaq ETFs introduce expense ratios, distributions, and capital gains. Neither path is frictionless. The after-tax, after-fee result is what matters to the investor.
Frequently asked questions
Did Bitcoin outperform Nasdaq over the last decade?
Yes, over many historical windows Bitcoin dramatically outperformed Nasdaq-style exposure on raw return. But it also experienced far larger drawdowns and volatility, which made it much harder to hold.
Is Nasdaq safer than Bitcoin?
Nasdaq exposure is generally less volatile than Bitcoin, but it is not risk-free. Technology-heavy equities can still fall sharply during bear markets, valuation resets, and interest-rate shocks.
Should I invest in Bitcoin or Nasdaq?
The answer depends on your risk tolerance, time horizon, conviction, tax situation, and portfolio design. Many investors treat Nasdaq exposure as a growth sleeve and Bitcoin as a smaller high-risk satellite allocation.
Is QQQ the same as Nasdaq?
No. QQQ tracks the Nasdaq-100, not the full Nasdaq Composite. It is often used as an investable proxy for technology-heavy Nasdaq exposure, but comparisons should clearly name the proxy used.
Does DCA work better for Bitcoin or Nasdaq?
DCA can help with both. It may be especially useful for Bitcoin because volatility is extreme, while Nasdaq DCA can be useful for investors who build exposure from monthly income.
What is the best Nasdaq proxy for a Bitcoin vs Nasdaq comparison?
Many investors use QQQ as an investable Nasdaq-100 proxy because it is widely traded and tracks large non-financial Nasdaq-listed companies. It is still important to say whether the comparison uses QQQ, Nasdaq-100, or the full Nasdaq Composite.
Does Bitcoin vs Nasdaq prove Bitcoin is the better investment?
No. Bitcoin vs Nasdaq can show historical outperformance, drawdowns, and volatility differences, but it does not prove which asset will be better in the future. The better choice depends on allocation size, risk tolerance, custody, taxes, and whether you can hold through difficult periods.
How can I test my own Bitcoin vs Nasdaq allocation?
Use the WhatIfInvested Simulator for quick historical tests. Use Premium DCA if you want to compare weighted portfolios, fees, benchmarks, rebalancing, saved scenarios, and report exports.
Educational simulation only. Historical performance does not guarantee future results. This article is educational, not financial advice. Crypto assets and equity funds can both lose value. Results vary by date range, data source, tax treatment, fees, custody, allocation, rebalancing, and investor behavior.